Time to Disease Onset and Survival Prognosis in Cancer
This application uses results published in the book B. Roy Frieden, Science from Fisher Information. A Unification, Cambridge University Press, 2004, chapters 1, 14, 15. The complete mathematical derivation of the determination of individual times to the onset of hepatocellular cancer growth, using the tumor masses (as determined for respective patients by CT imaging at the “baseline” clinical examination), can be found in the text, linked HERE.
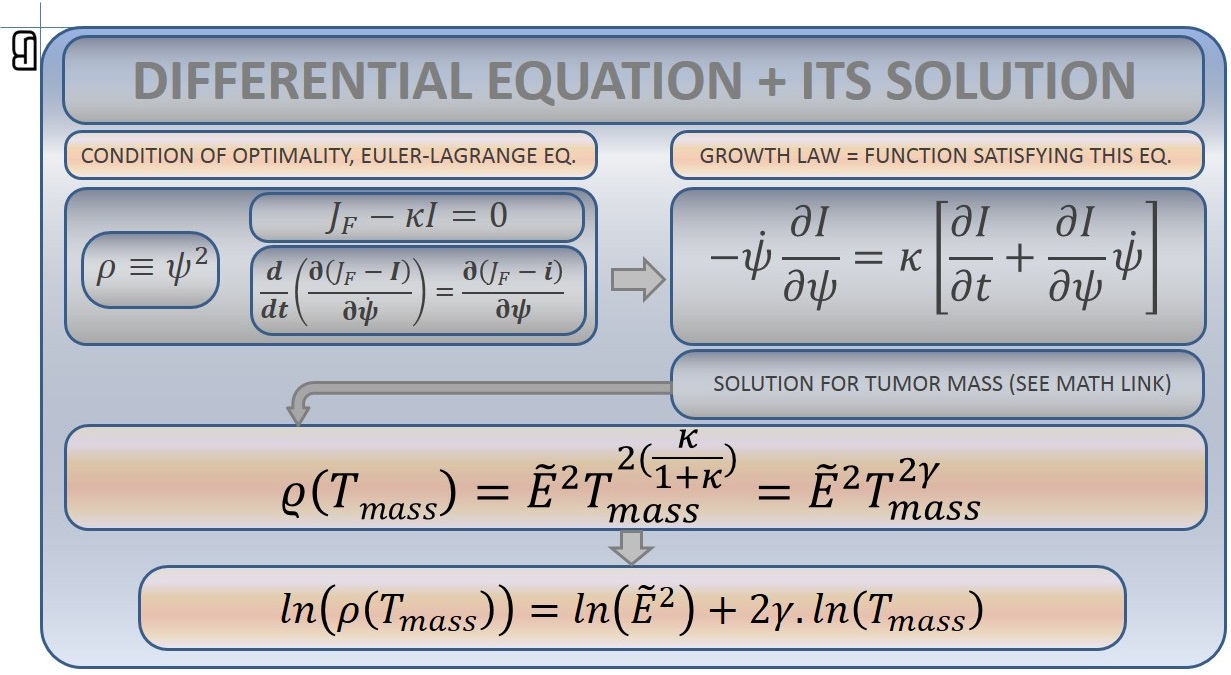
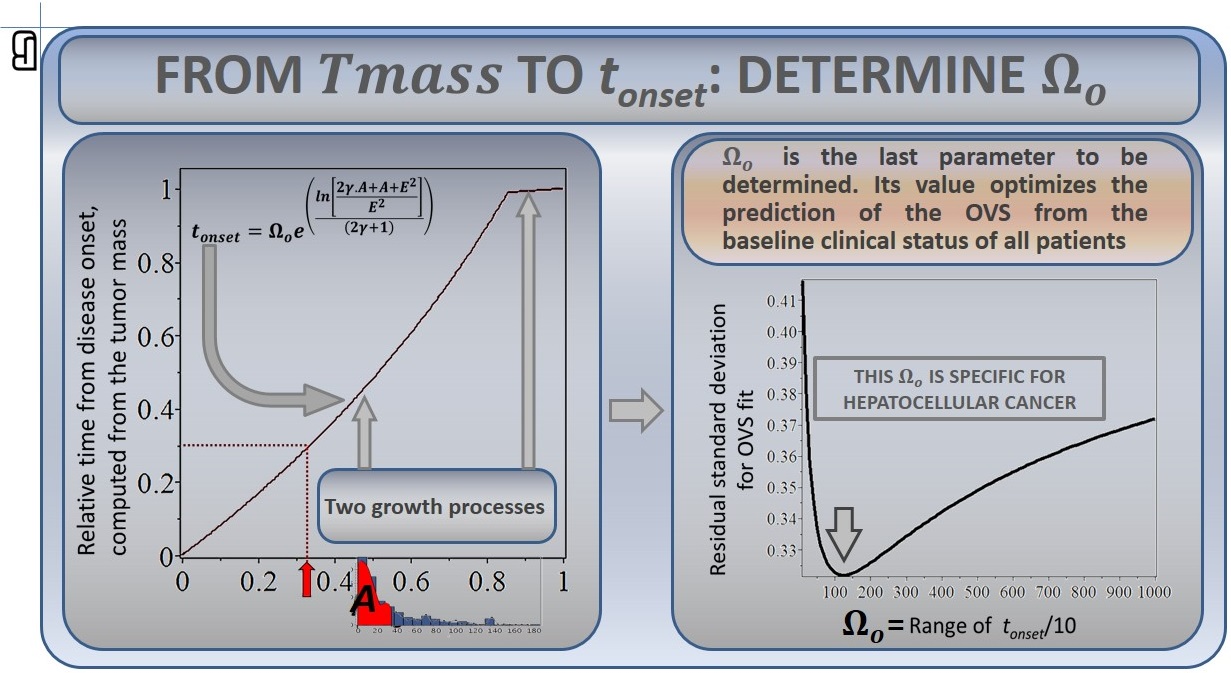
For details of the following result, see the derivation, eq. (24–26), page 6.
For details of the following result, see the derivation, eq. (32–33), page 8.
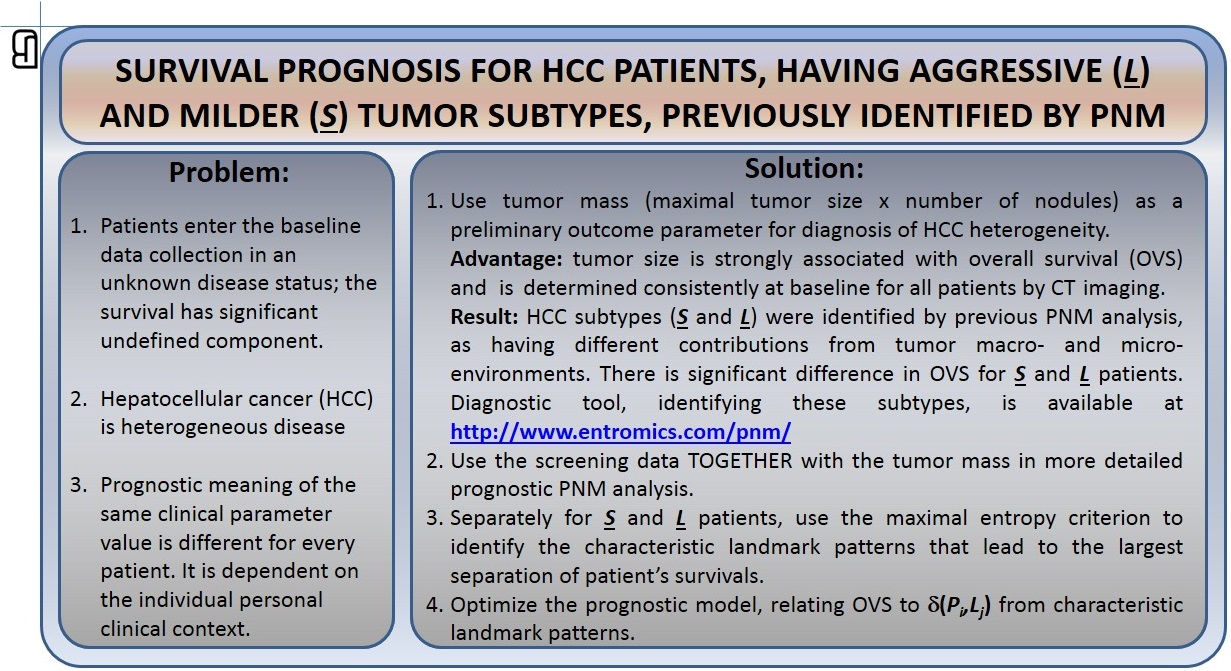
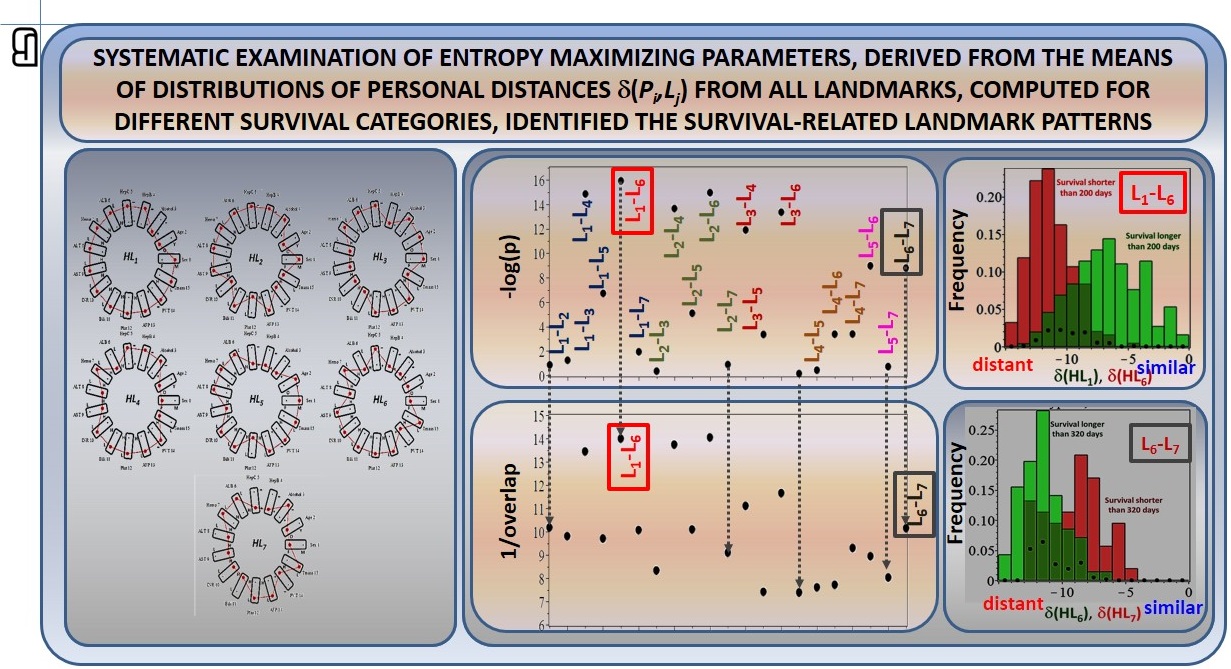
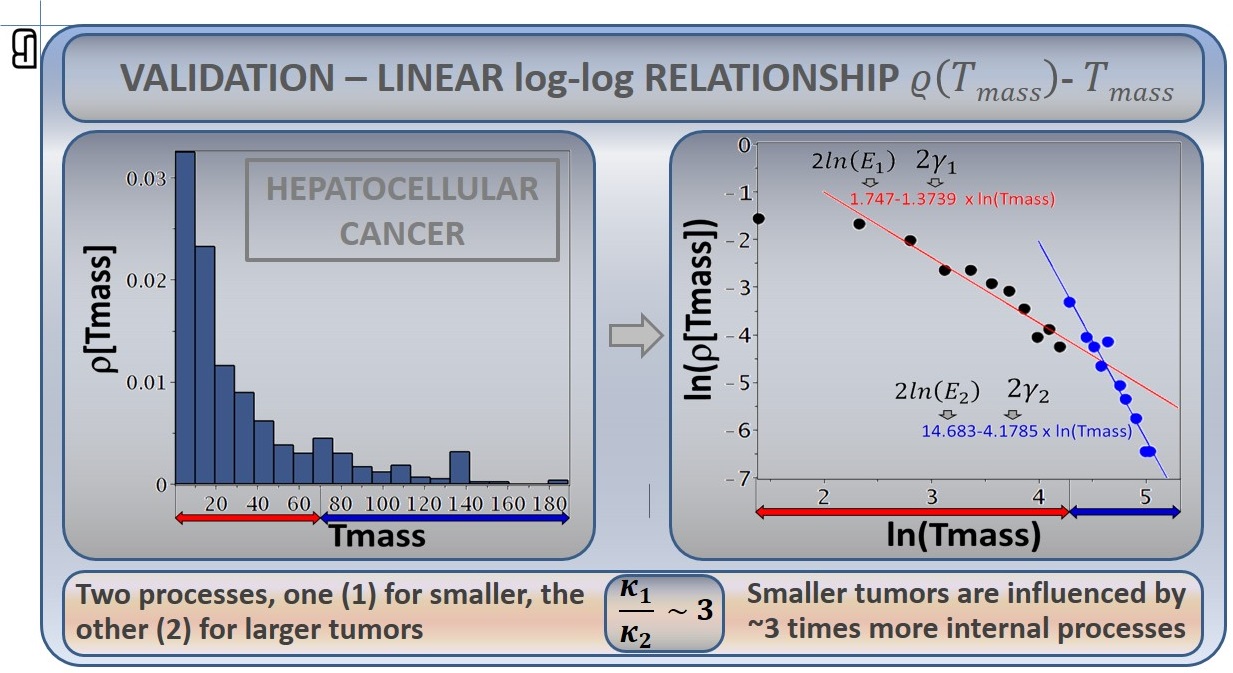
The “threshold” tumor mass of 70 resulted from the fact that the linear fit of the actual log-log transformed data, using two linear relationships, is statistically significantly better than fitting the same data by just one linear function. These two relationships (black and blue points, right panel below) have a threshold at ln(4.25), corresponding to Tmass = 70. The ratio of ~3 for the tumorigenesis processes in tumors with mass up to 70, compared to larger tumors, follows from the derived expression for the power constant — see eq. (41) in the derivation, page 10 — into which we entered the numerical values obtained from linear fits of the two sets of data points in the log-log transformed Tmass histogram.
The following result is obtained by the derivation, eq. (49–51), page 12.
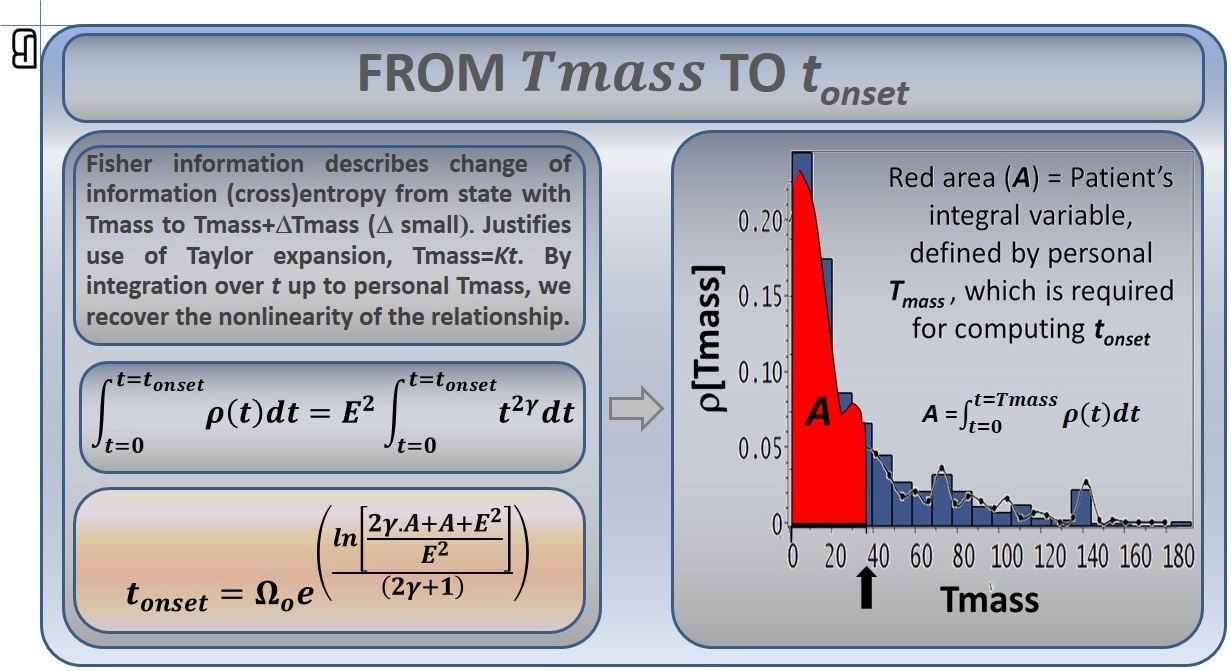
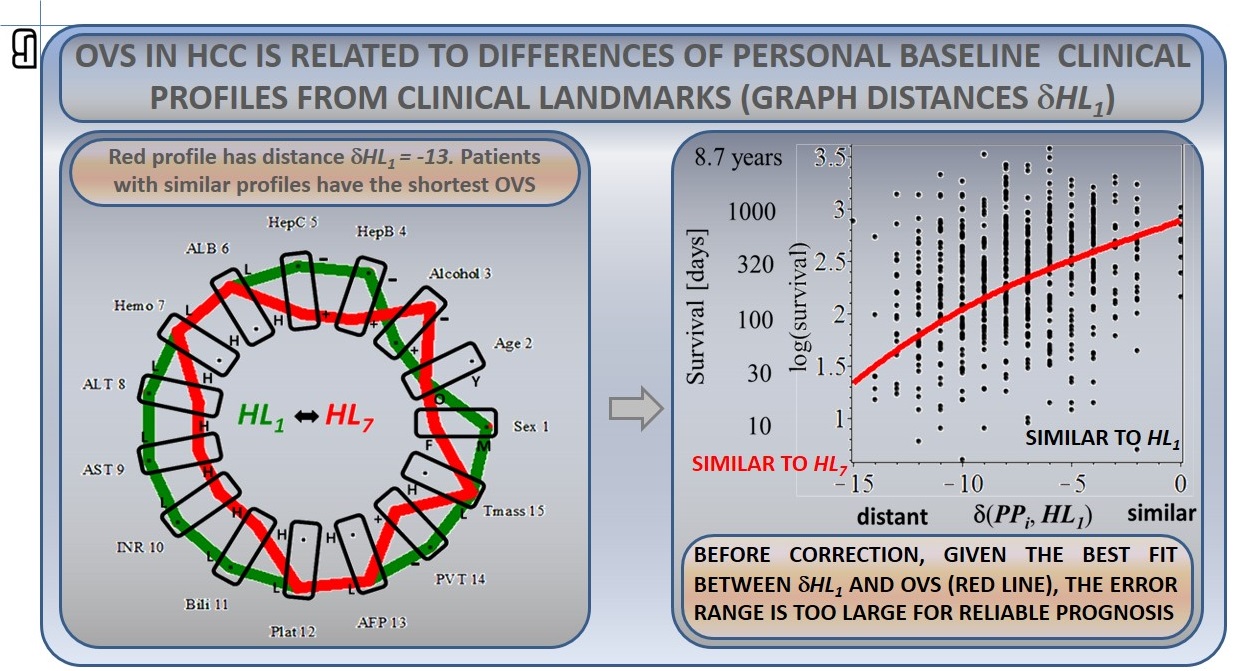
For details, see the derivation, pages 14–15.
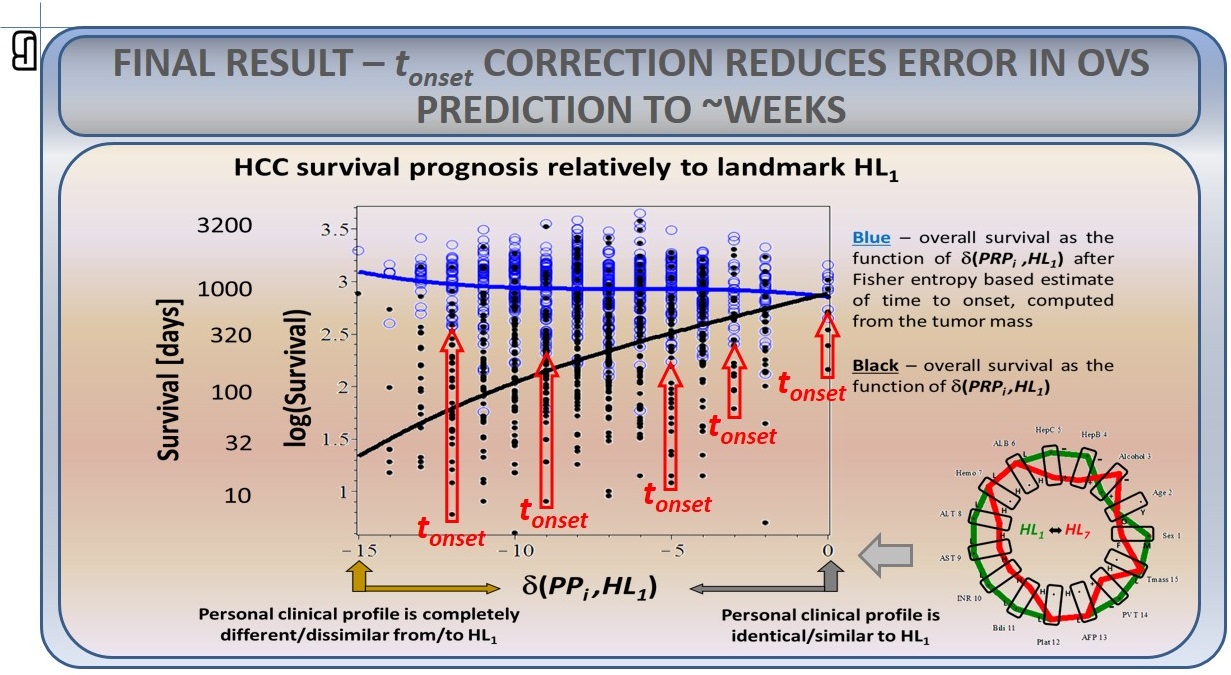
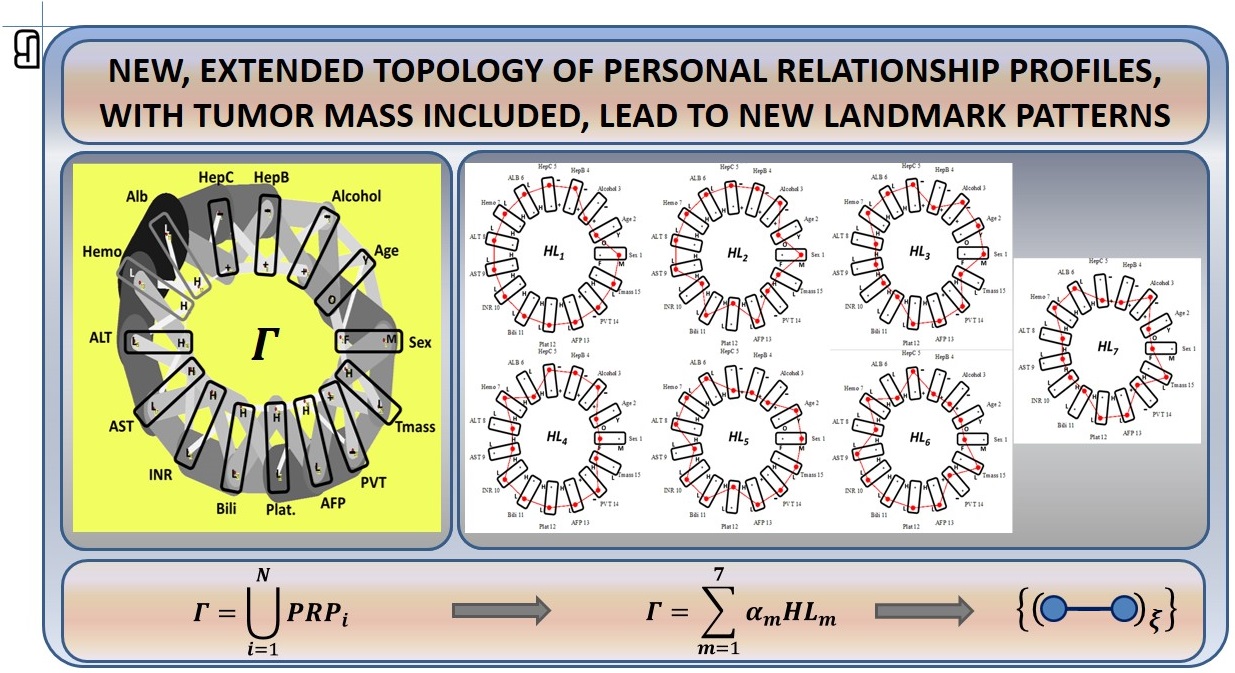
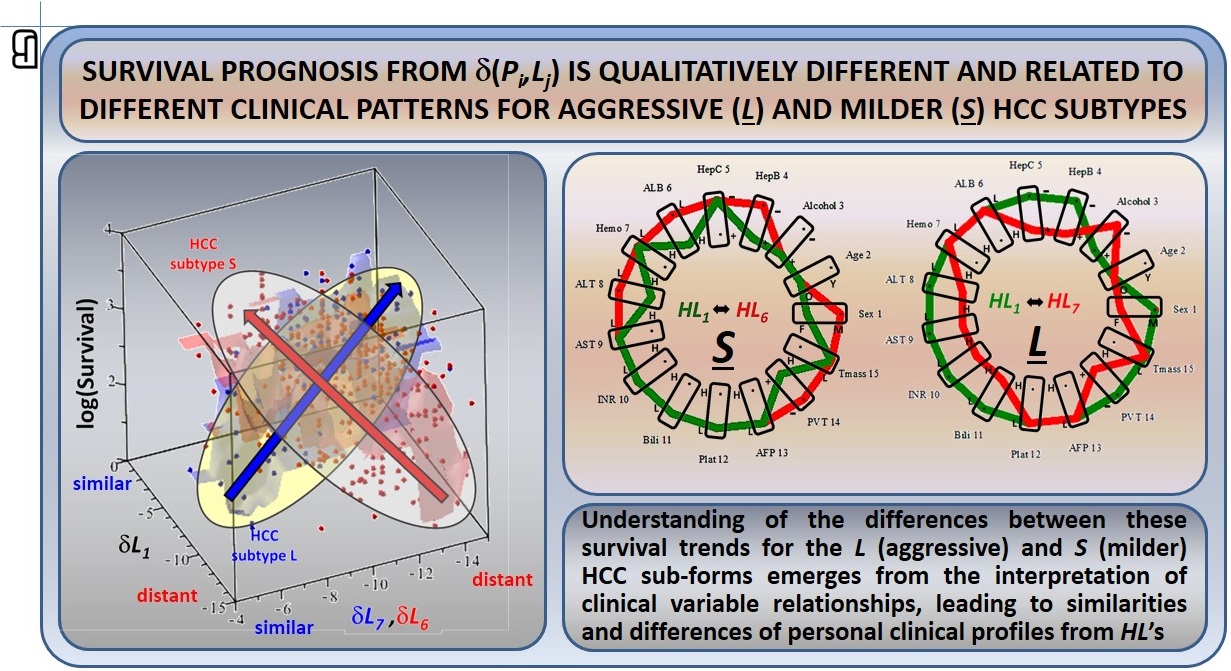
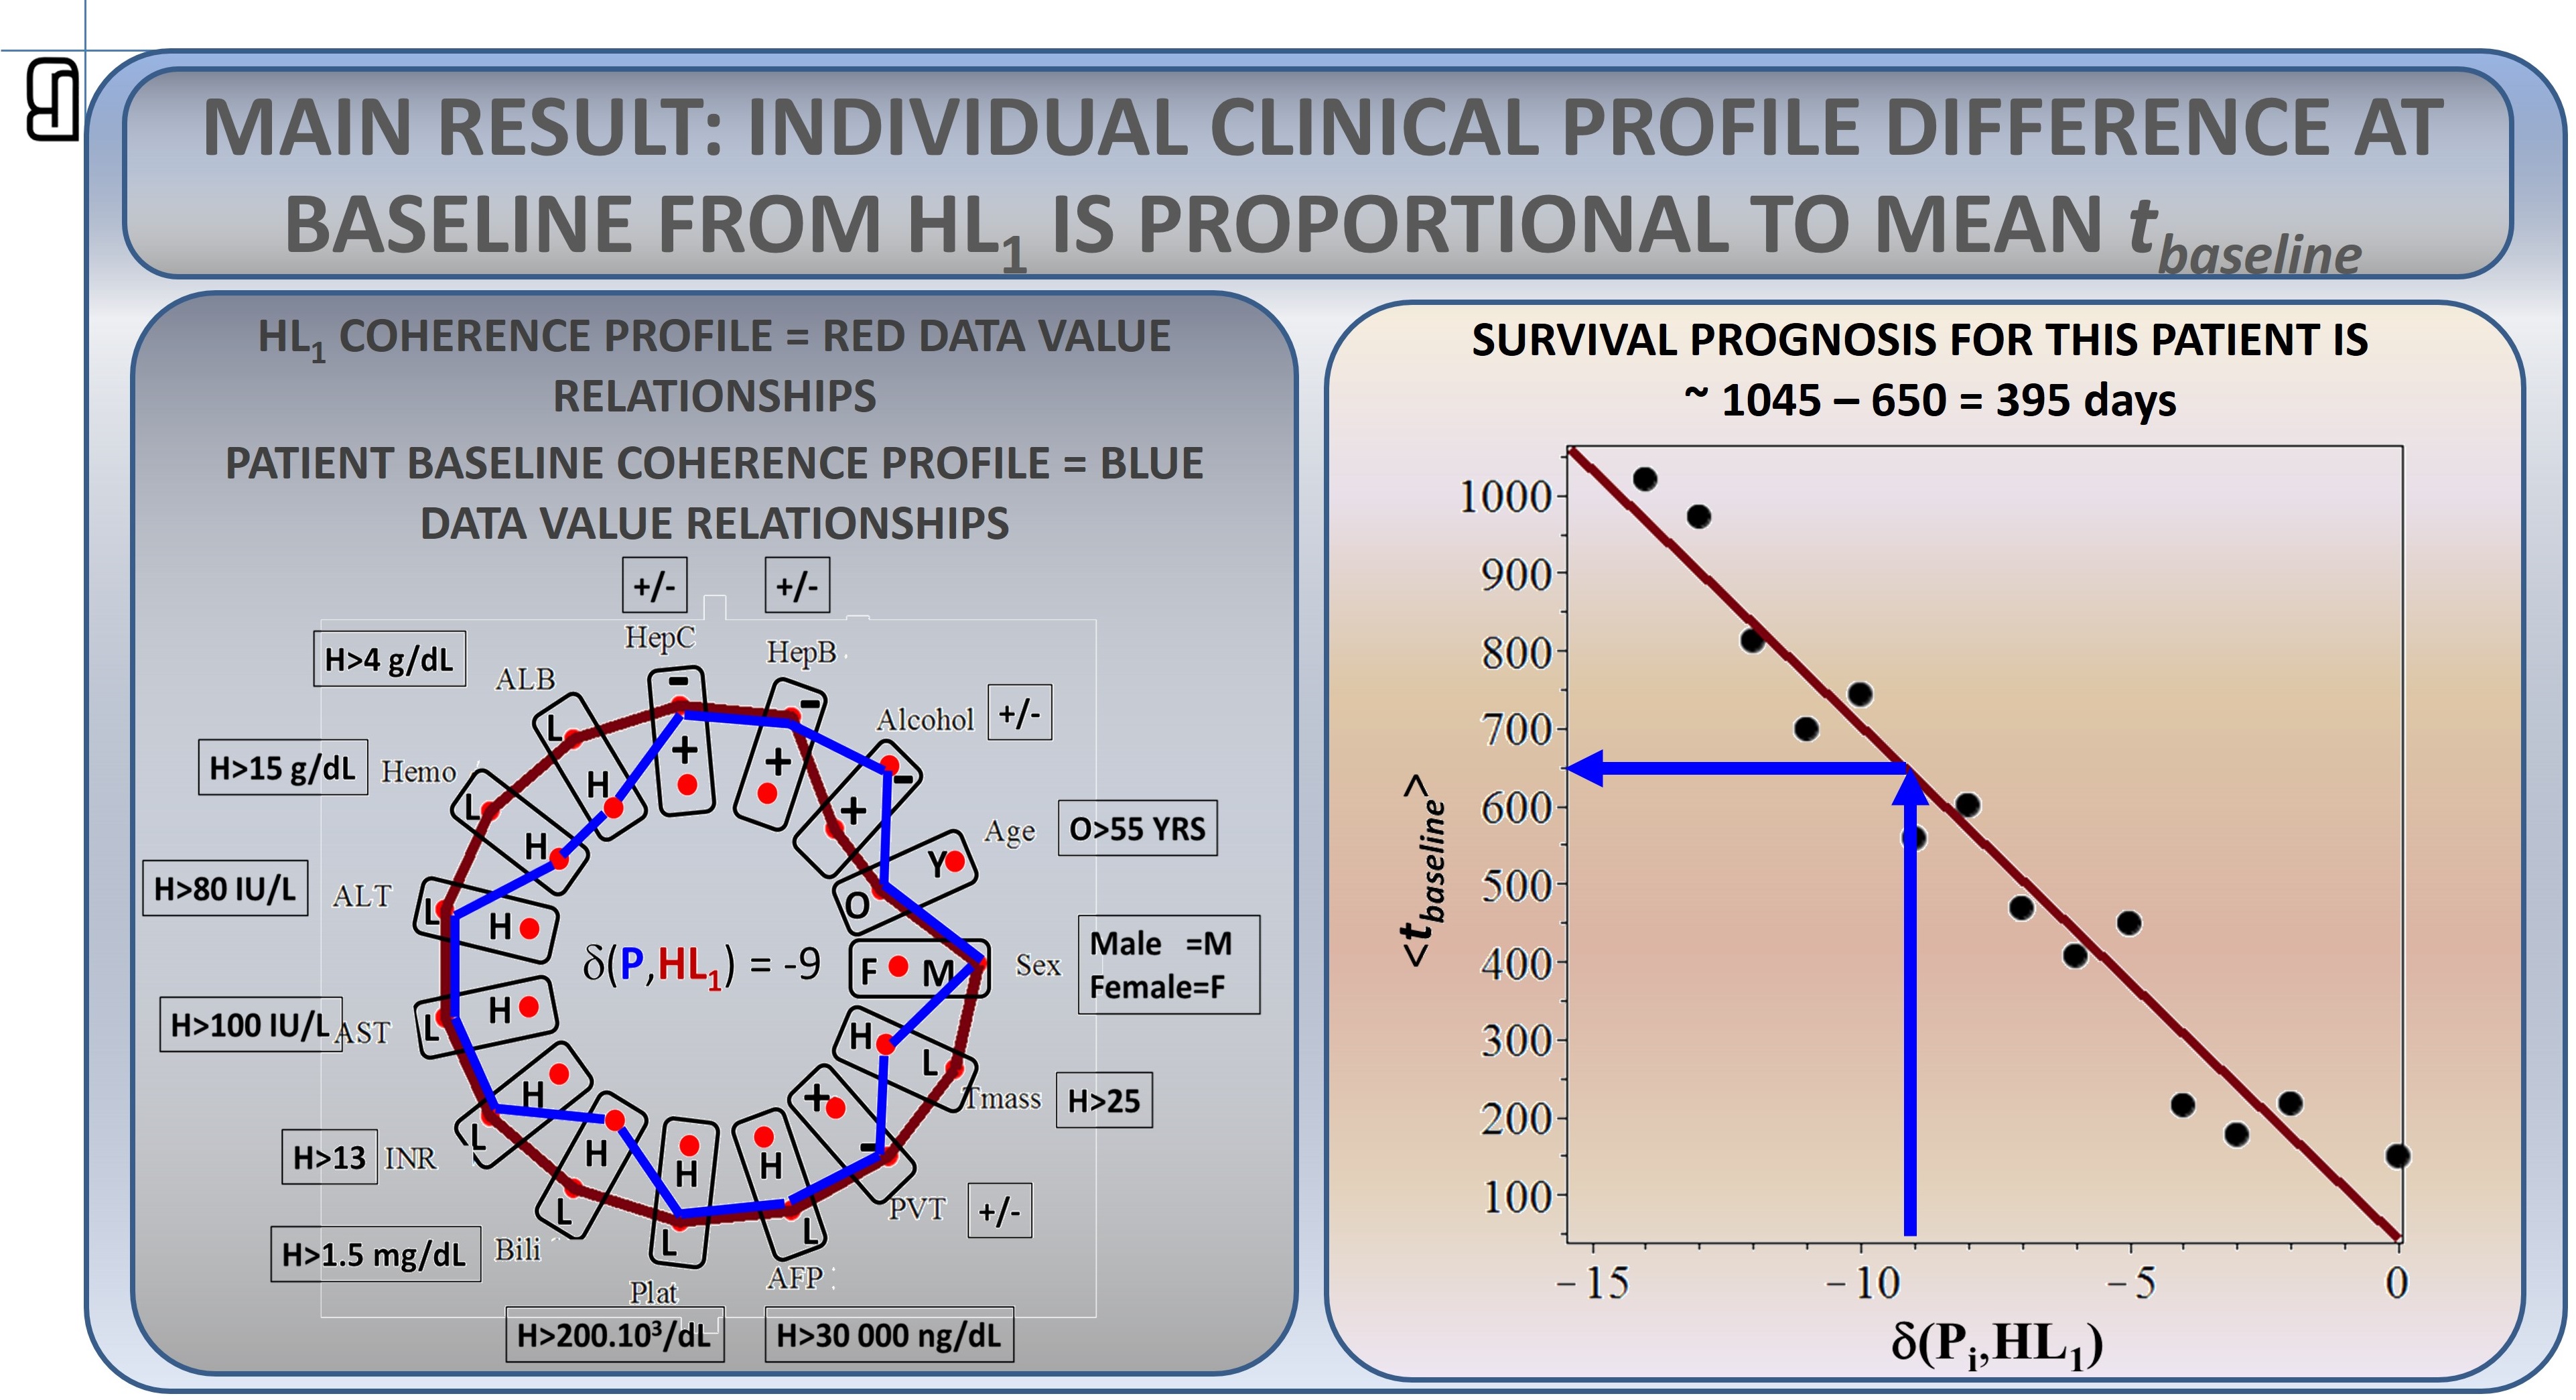
An important practical result, which brings us closer to calculating survival from baseline diagnosis of individual patients, is that there is a simple linear relationship between the difference of the personal coherence profile (found for any patient at baseline) from the “all low” common-data-value reference profile (HL1) and the mean time <tonset> that has passed from disease onset until clinical diagnosis. As we found that all HCC patients have the same mean total disease duration (OVSC ~ 1045 days), survival prognosis for every one of the 15 possible clinical statuses of any patient can be determined simply, as shown below.
A worksheet implementation of this personalized HCC survival prognosis, as described in the paper, is available for download. Below is a screenshot summarizing the functions of this tool.
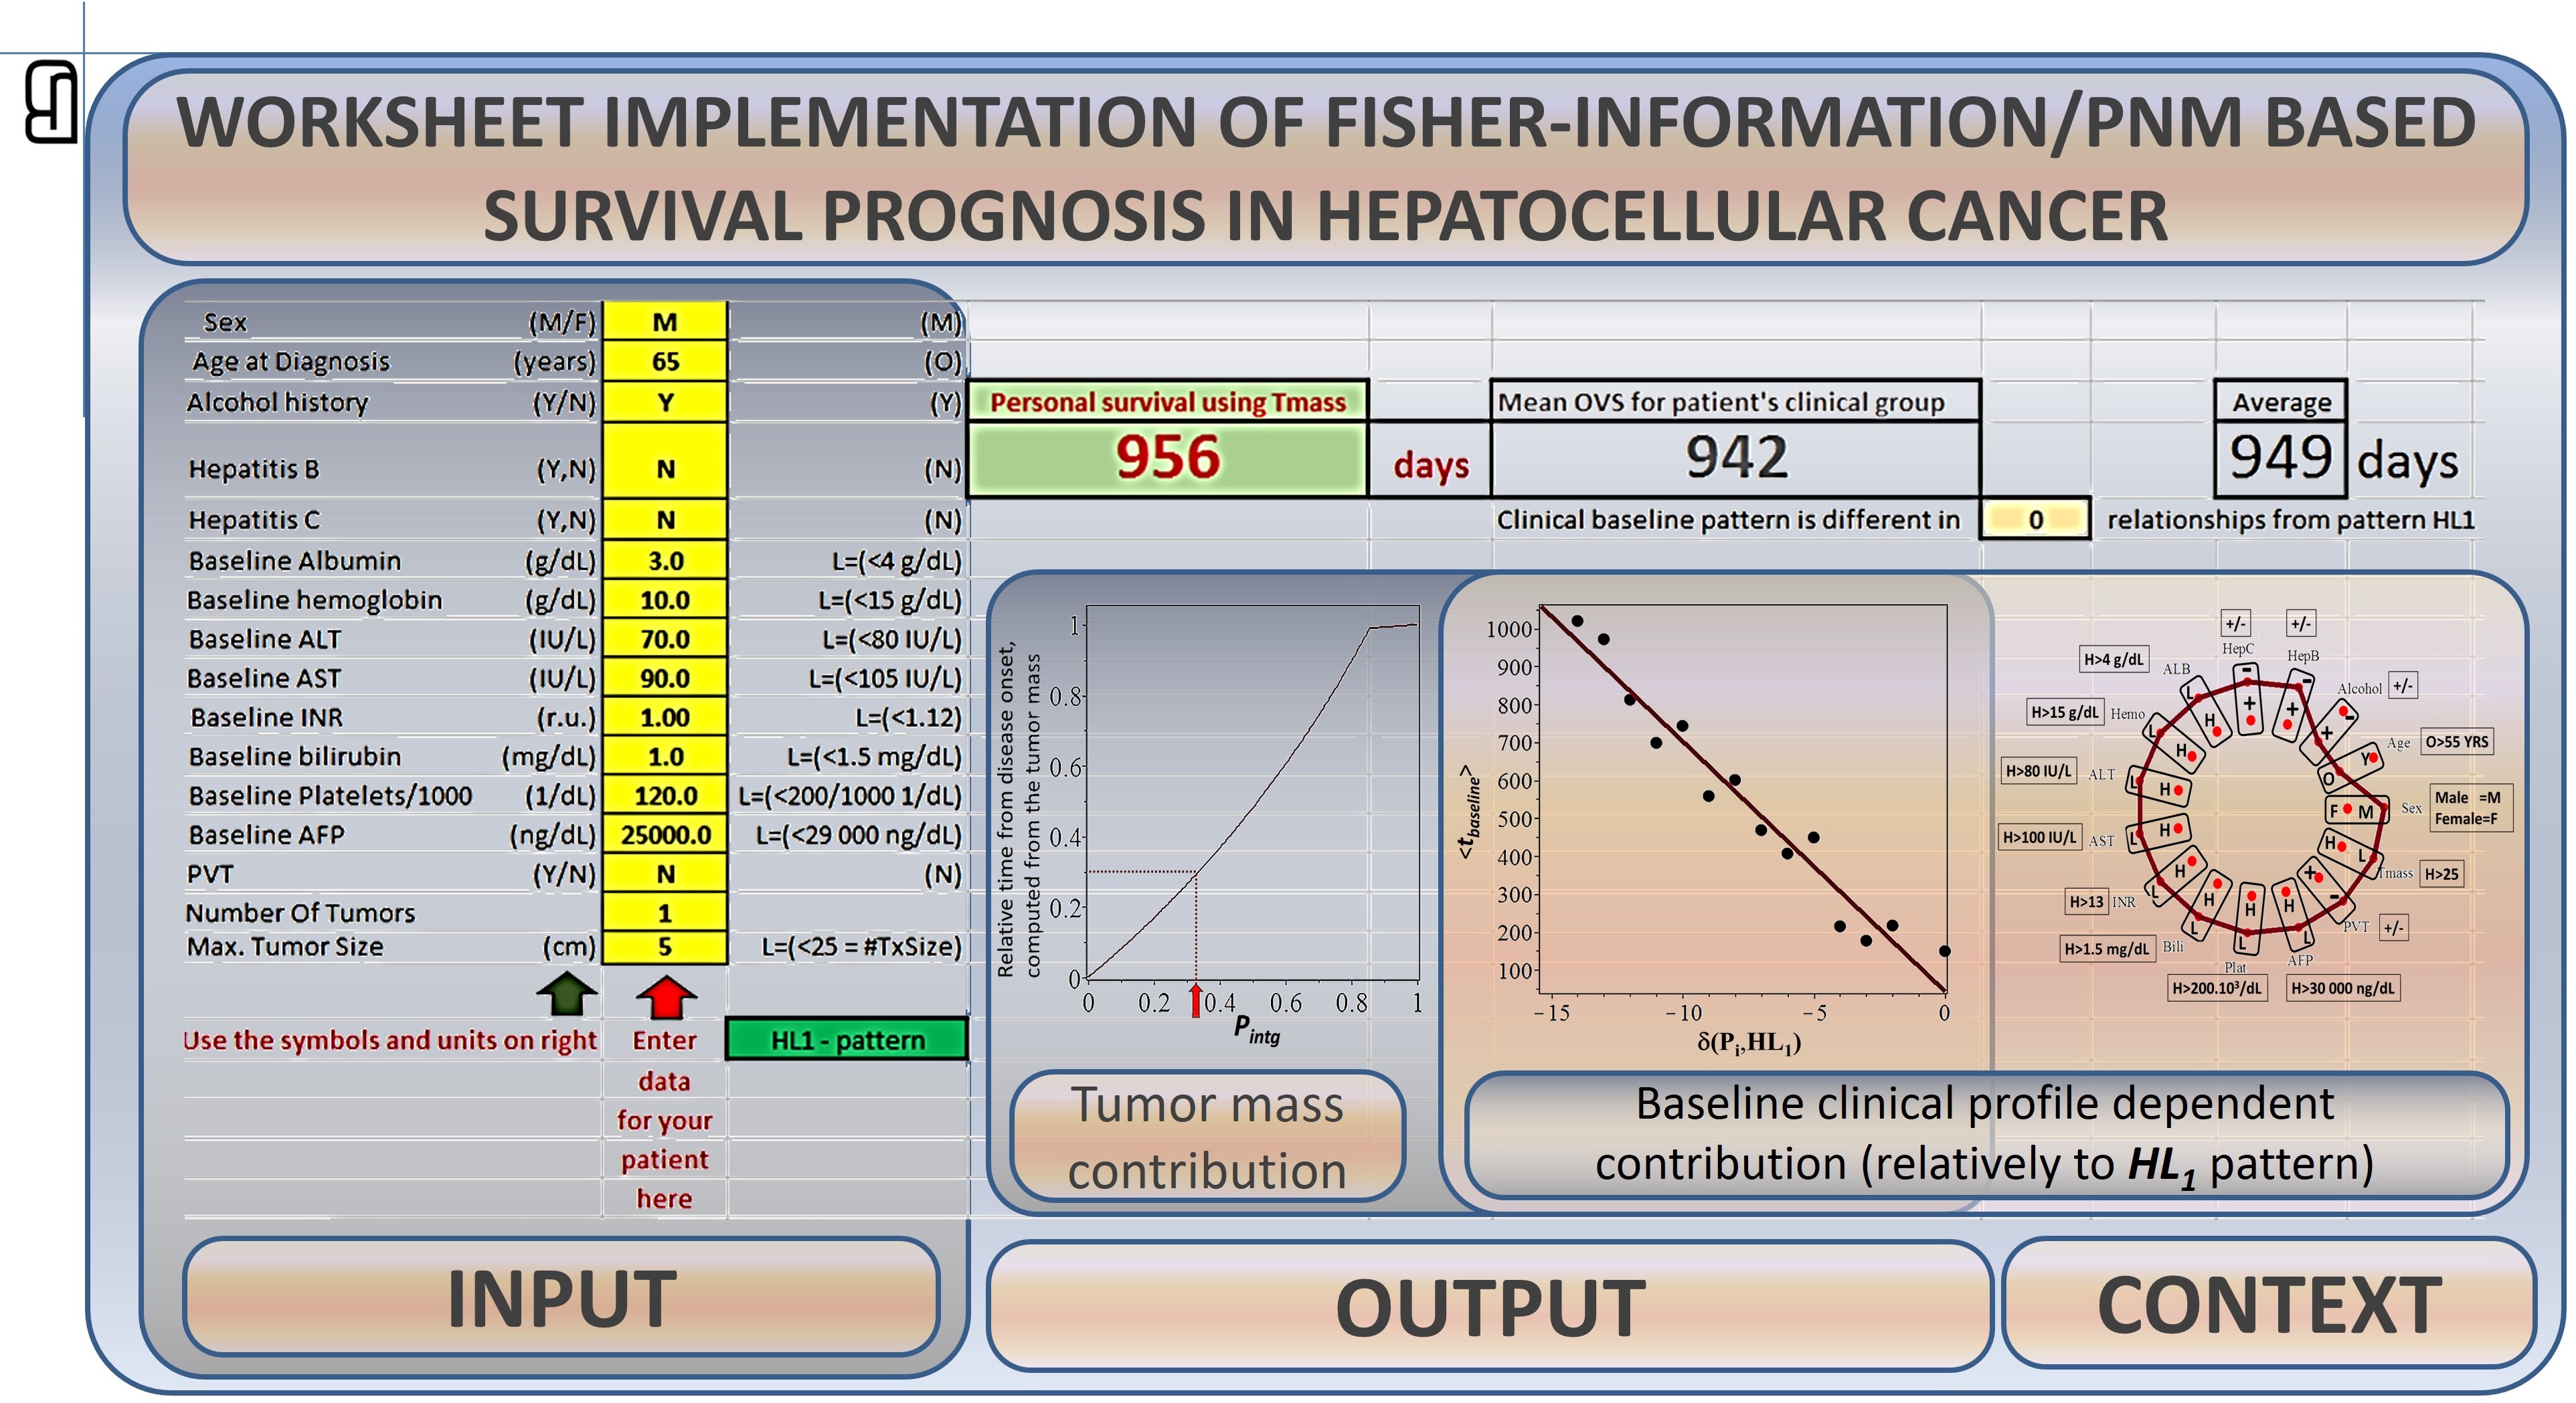
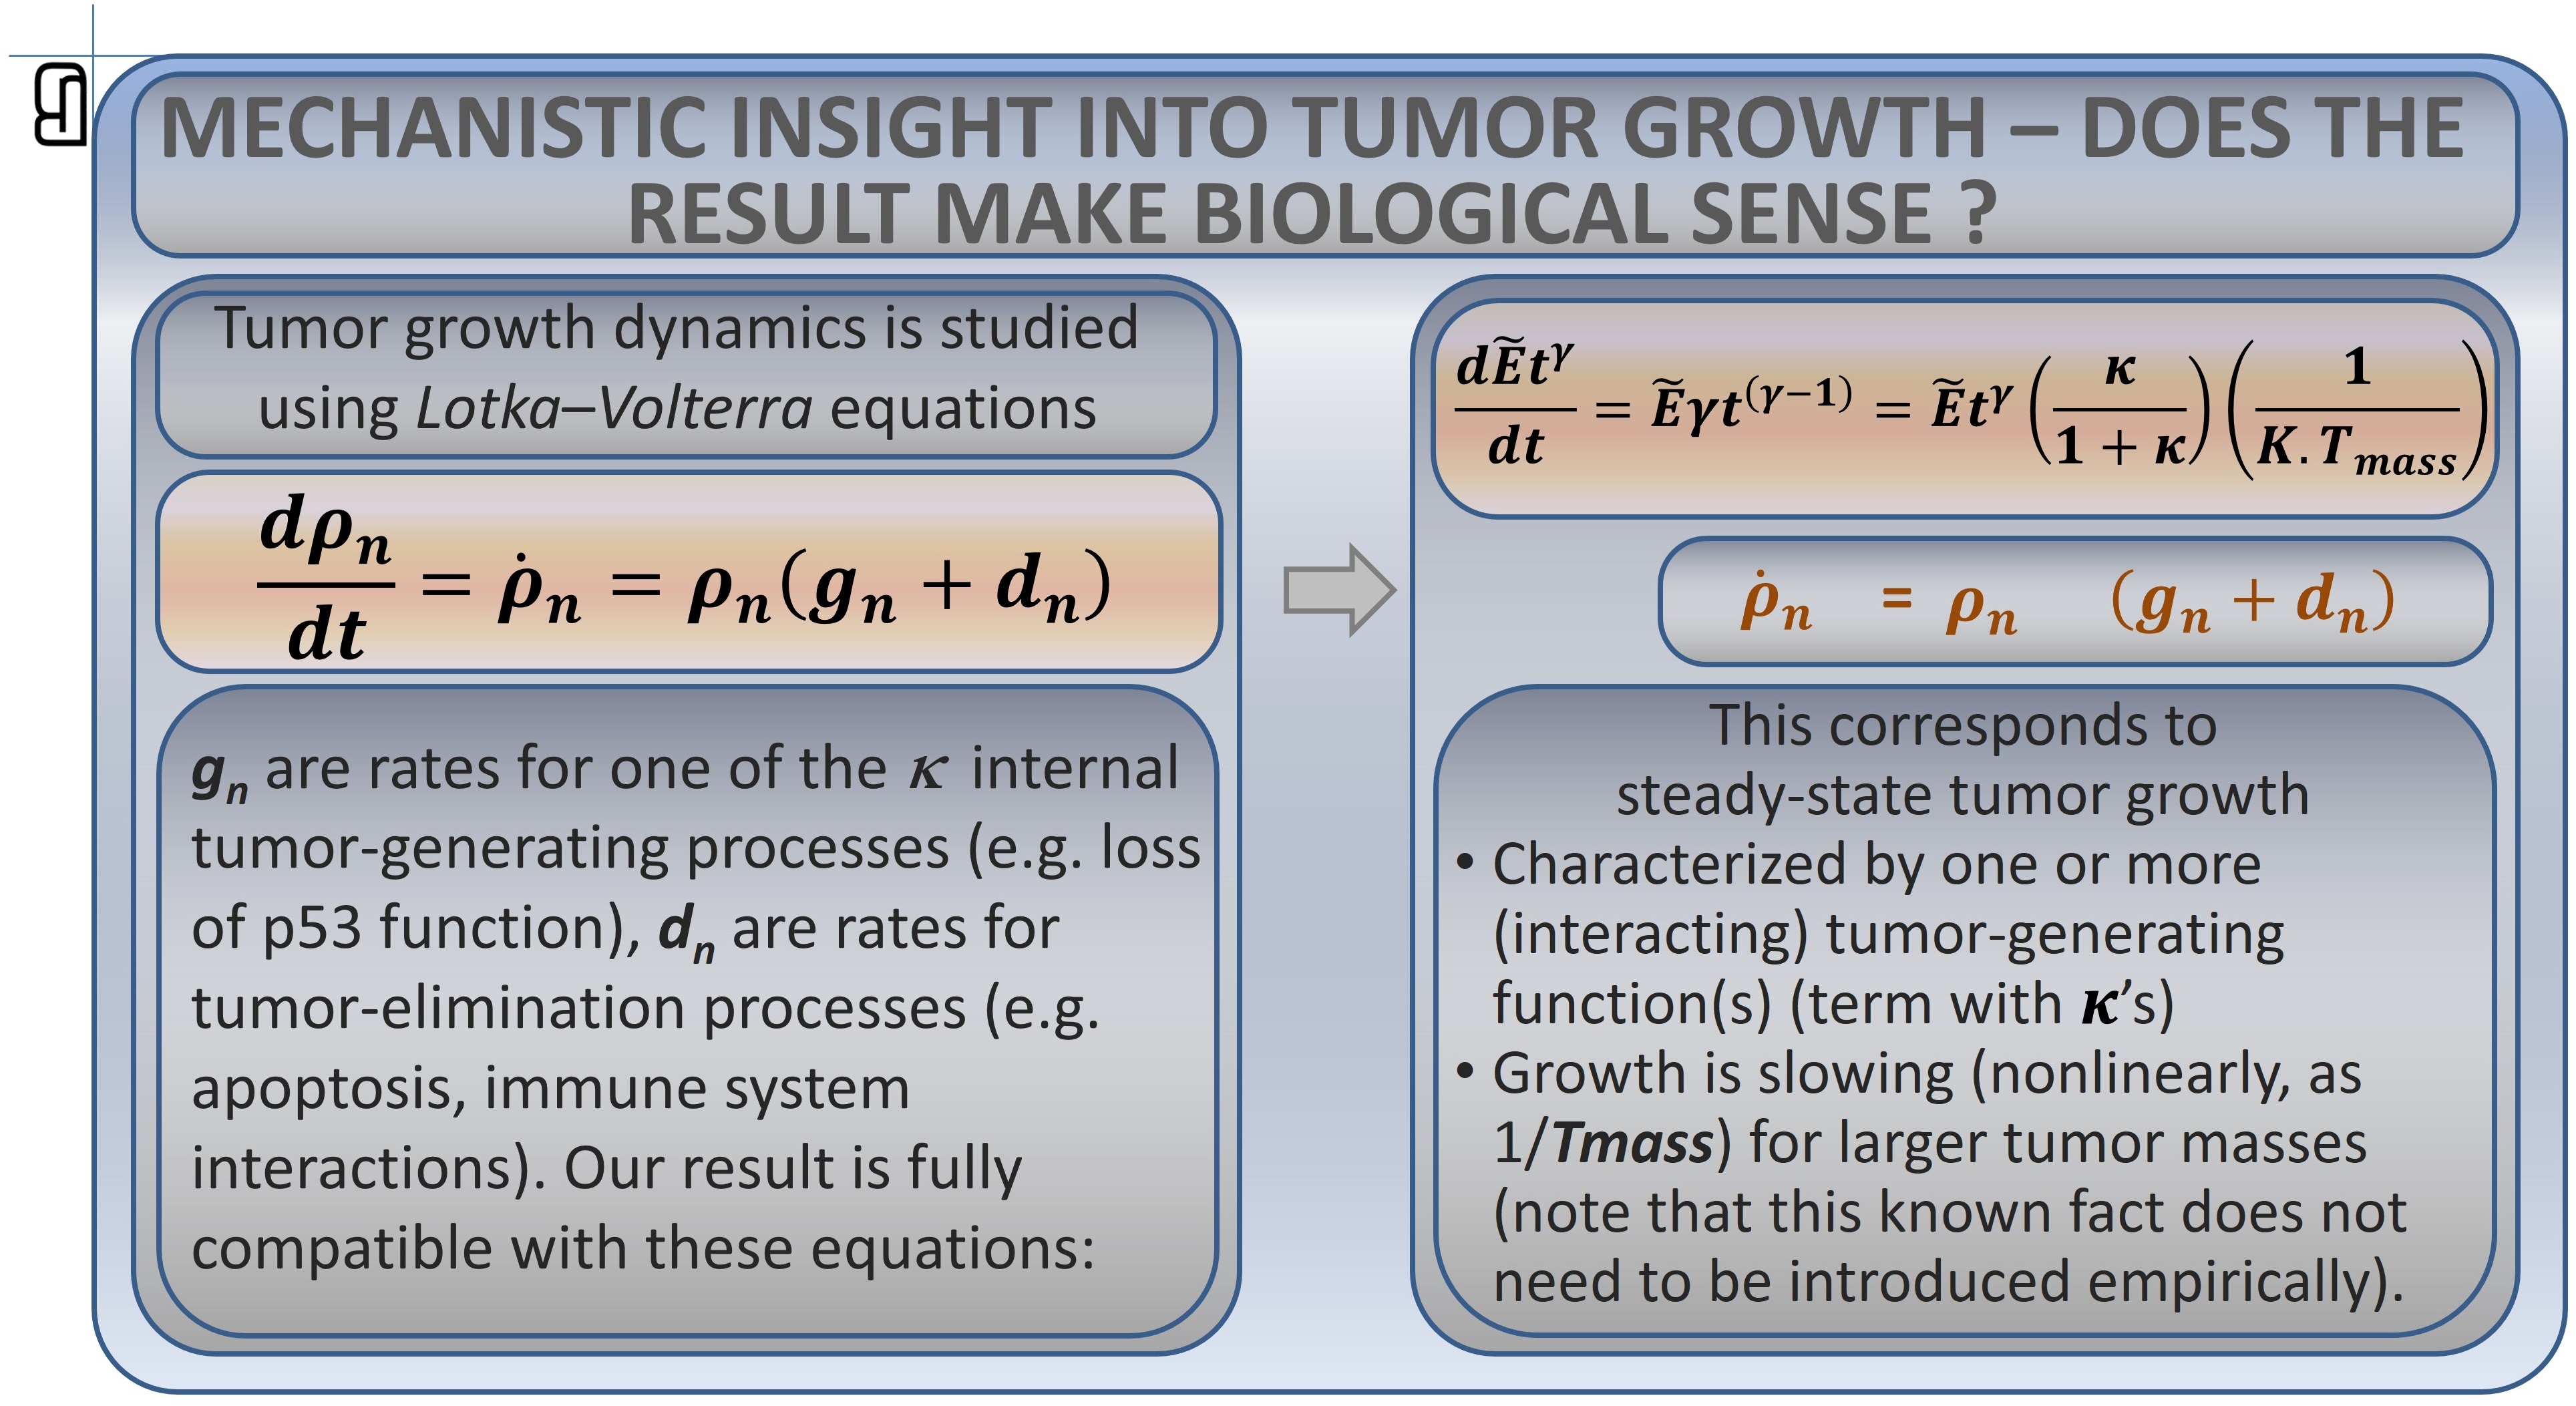
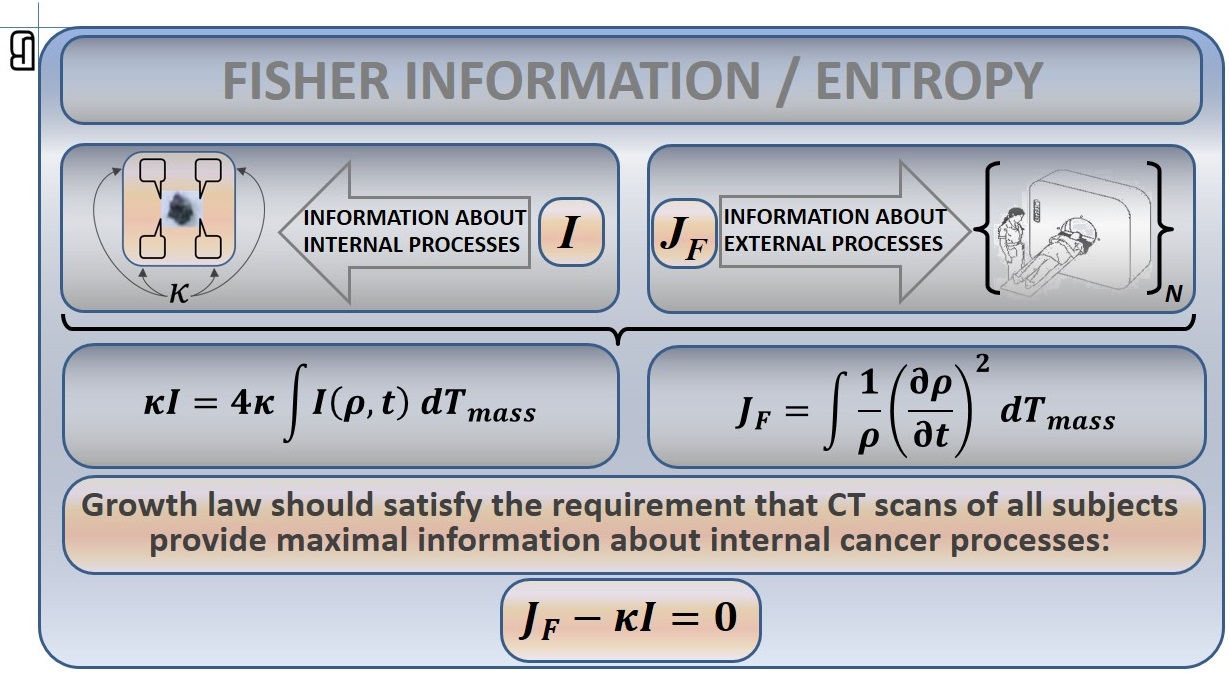
Because Fisher information processing of the baseline clinical data is not empirical, it provides important mechanistic insights into the tumor-growth process, which can be used for hypothesis generation and/or validation: