Fisher Information Analysis of Syntax Score
Why Fisher information processing?
For clinical-practice data we typically do not have a “control” patient cohort, so we cannot use the fact that a normal distribution describes only the fully stochastic variation in a patient’s data to extract the “true”, clinically relevant information from case/control comparisons.
Thus, if we have only one variable (such as a diagnostic score) which should support the selection of alternative treatments, and only the “case” cohort data to analyze, then it is clearly more logical to follow any NON-RANDOMNESS in the clinical factors’ manifestation in the score values. Such non-randomness is evidence that something truly observable is happening in the patient’s clinical status/system and — with the appropriate approach — we can take advantage of that.
With more detailed clinical-practice data available, the deviations of data histograms from the normal distribution are more and more reliably quantifiable.
Fisher information is a rigorous theoretical framework, providing tools and “recipes” for how to process the information in the observed “non-Gaussian” shape of the prognostic score/variable distribution.
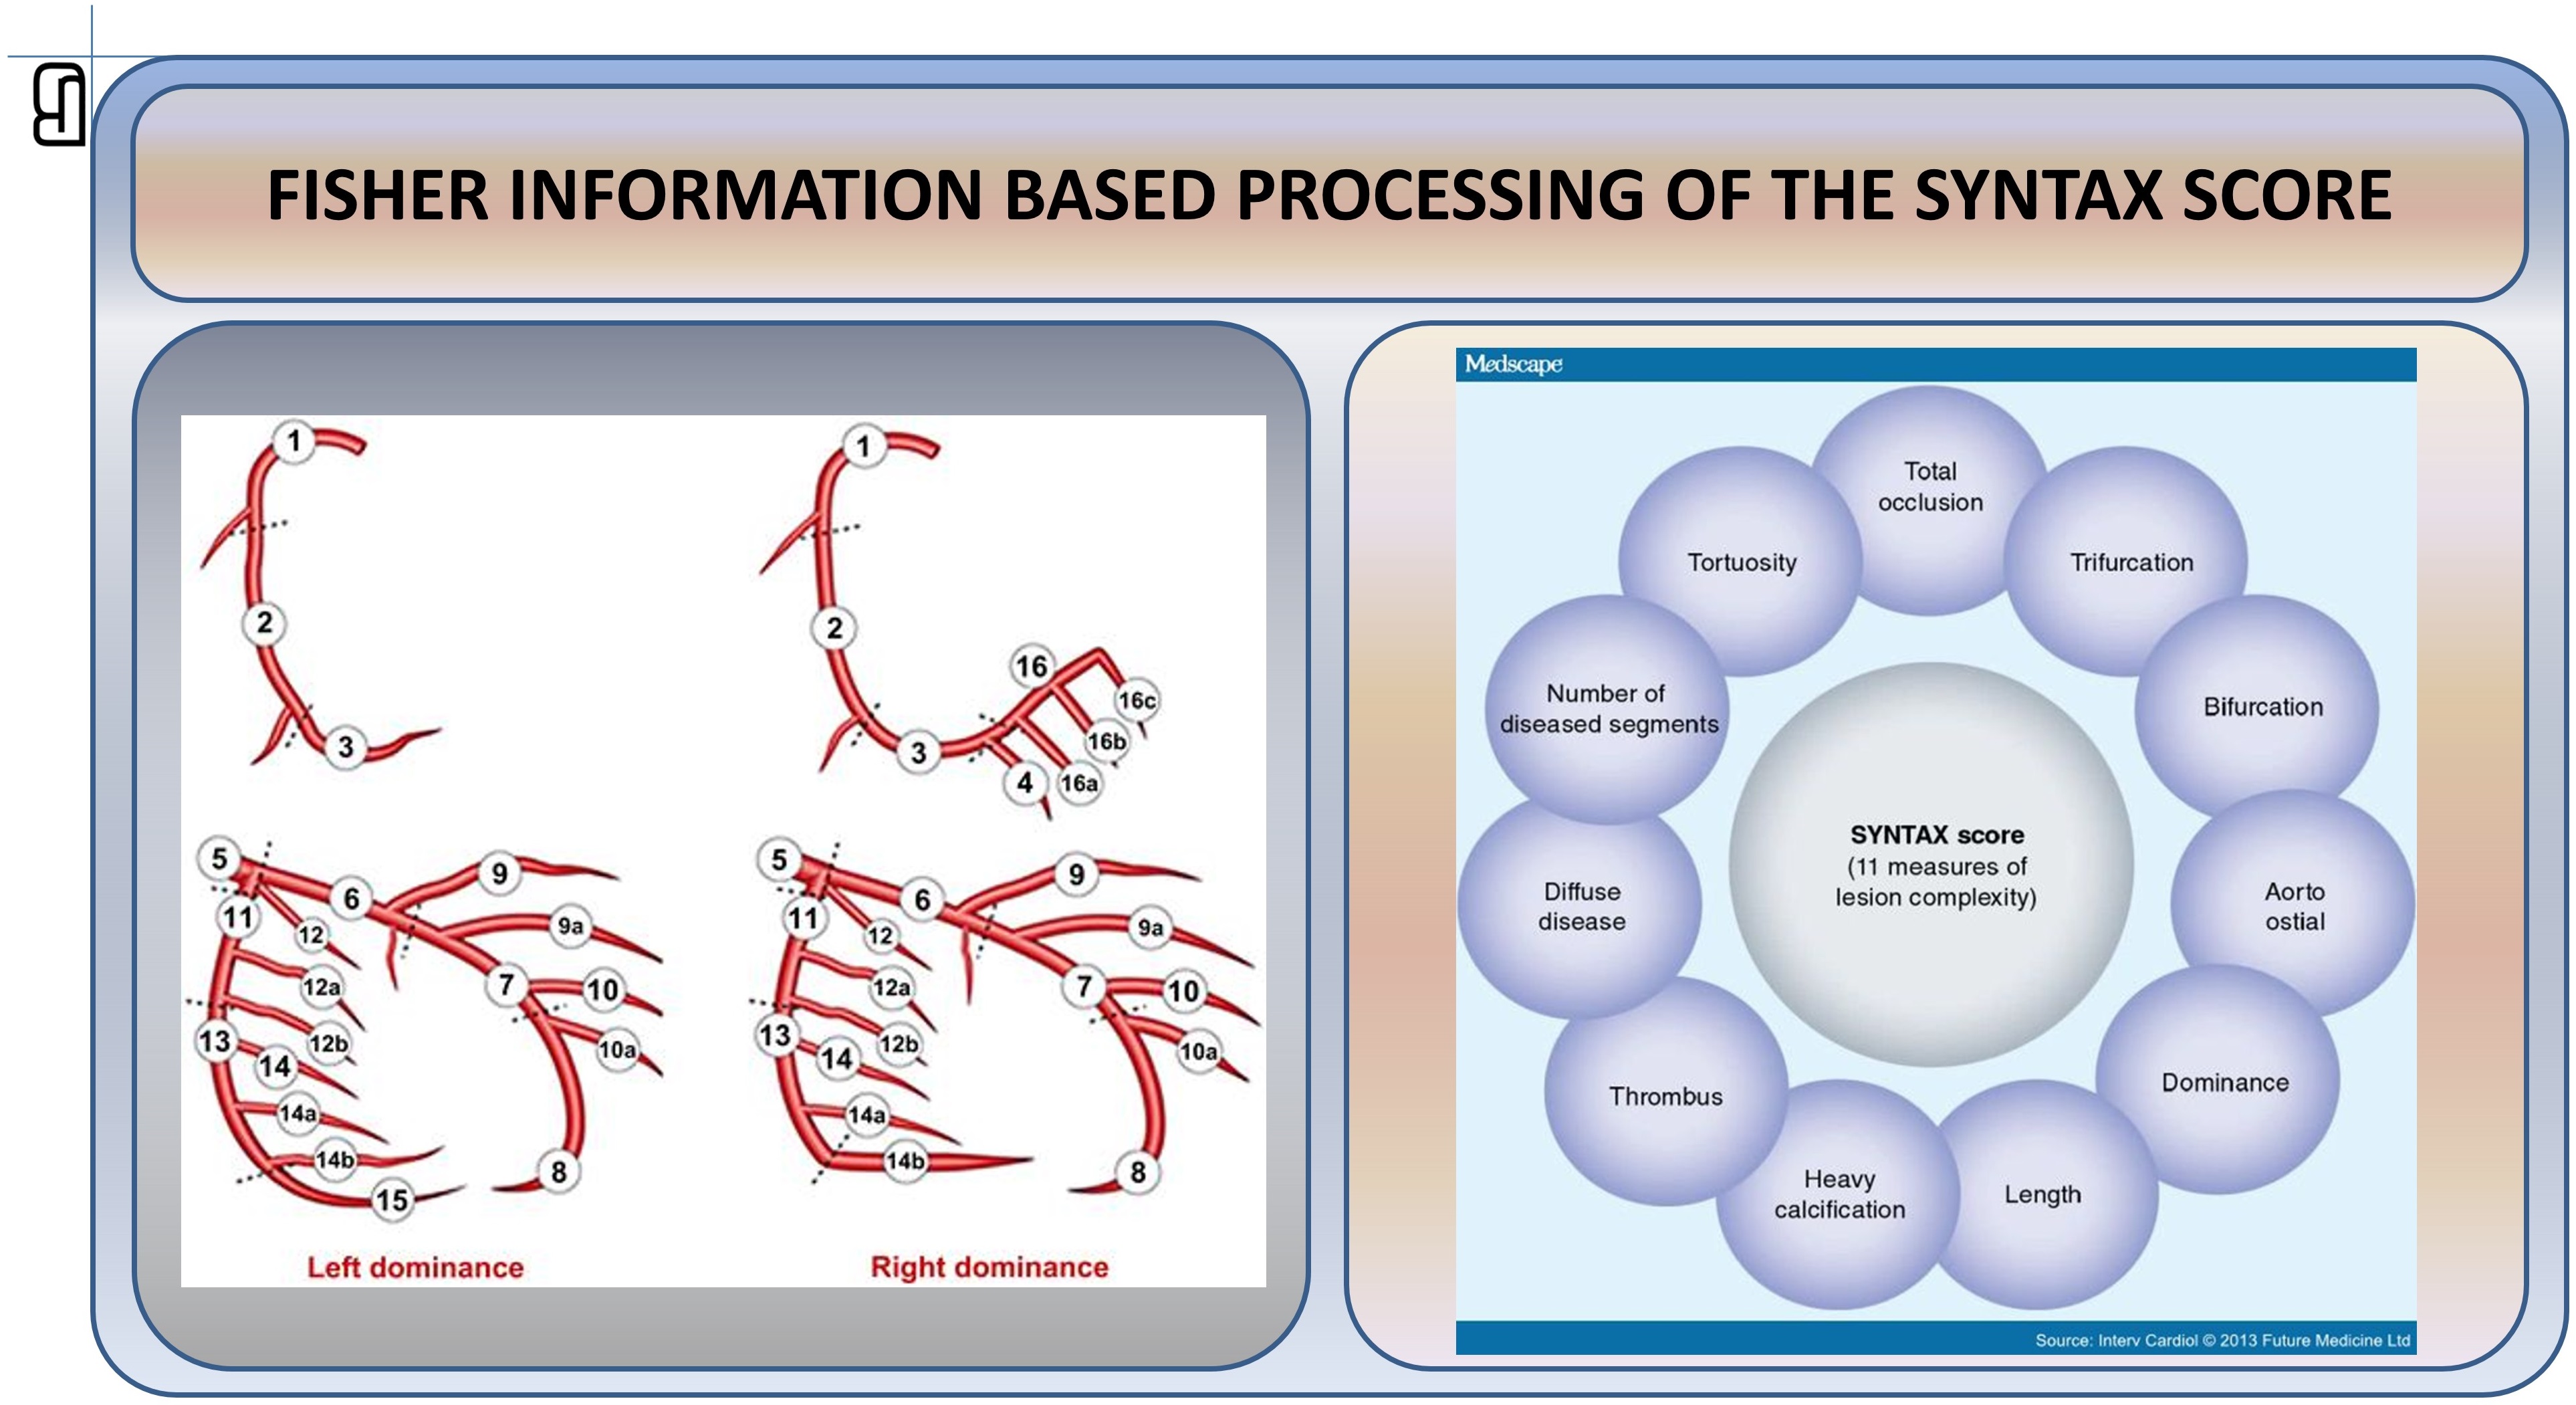
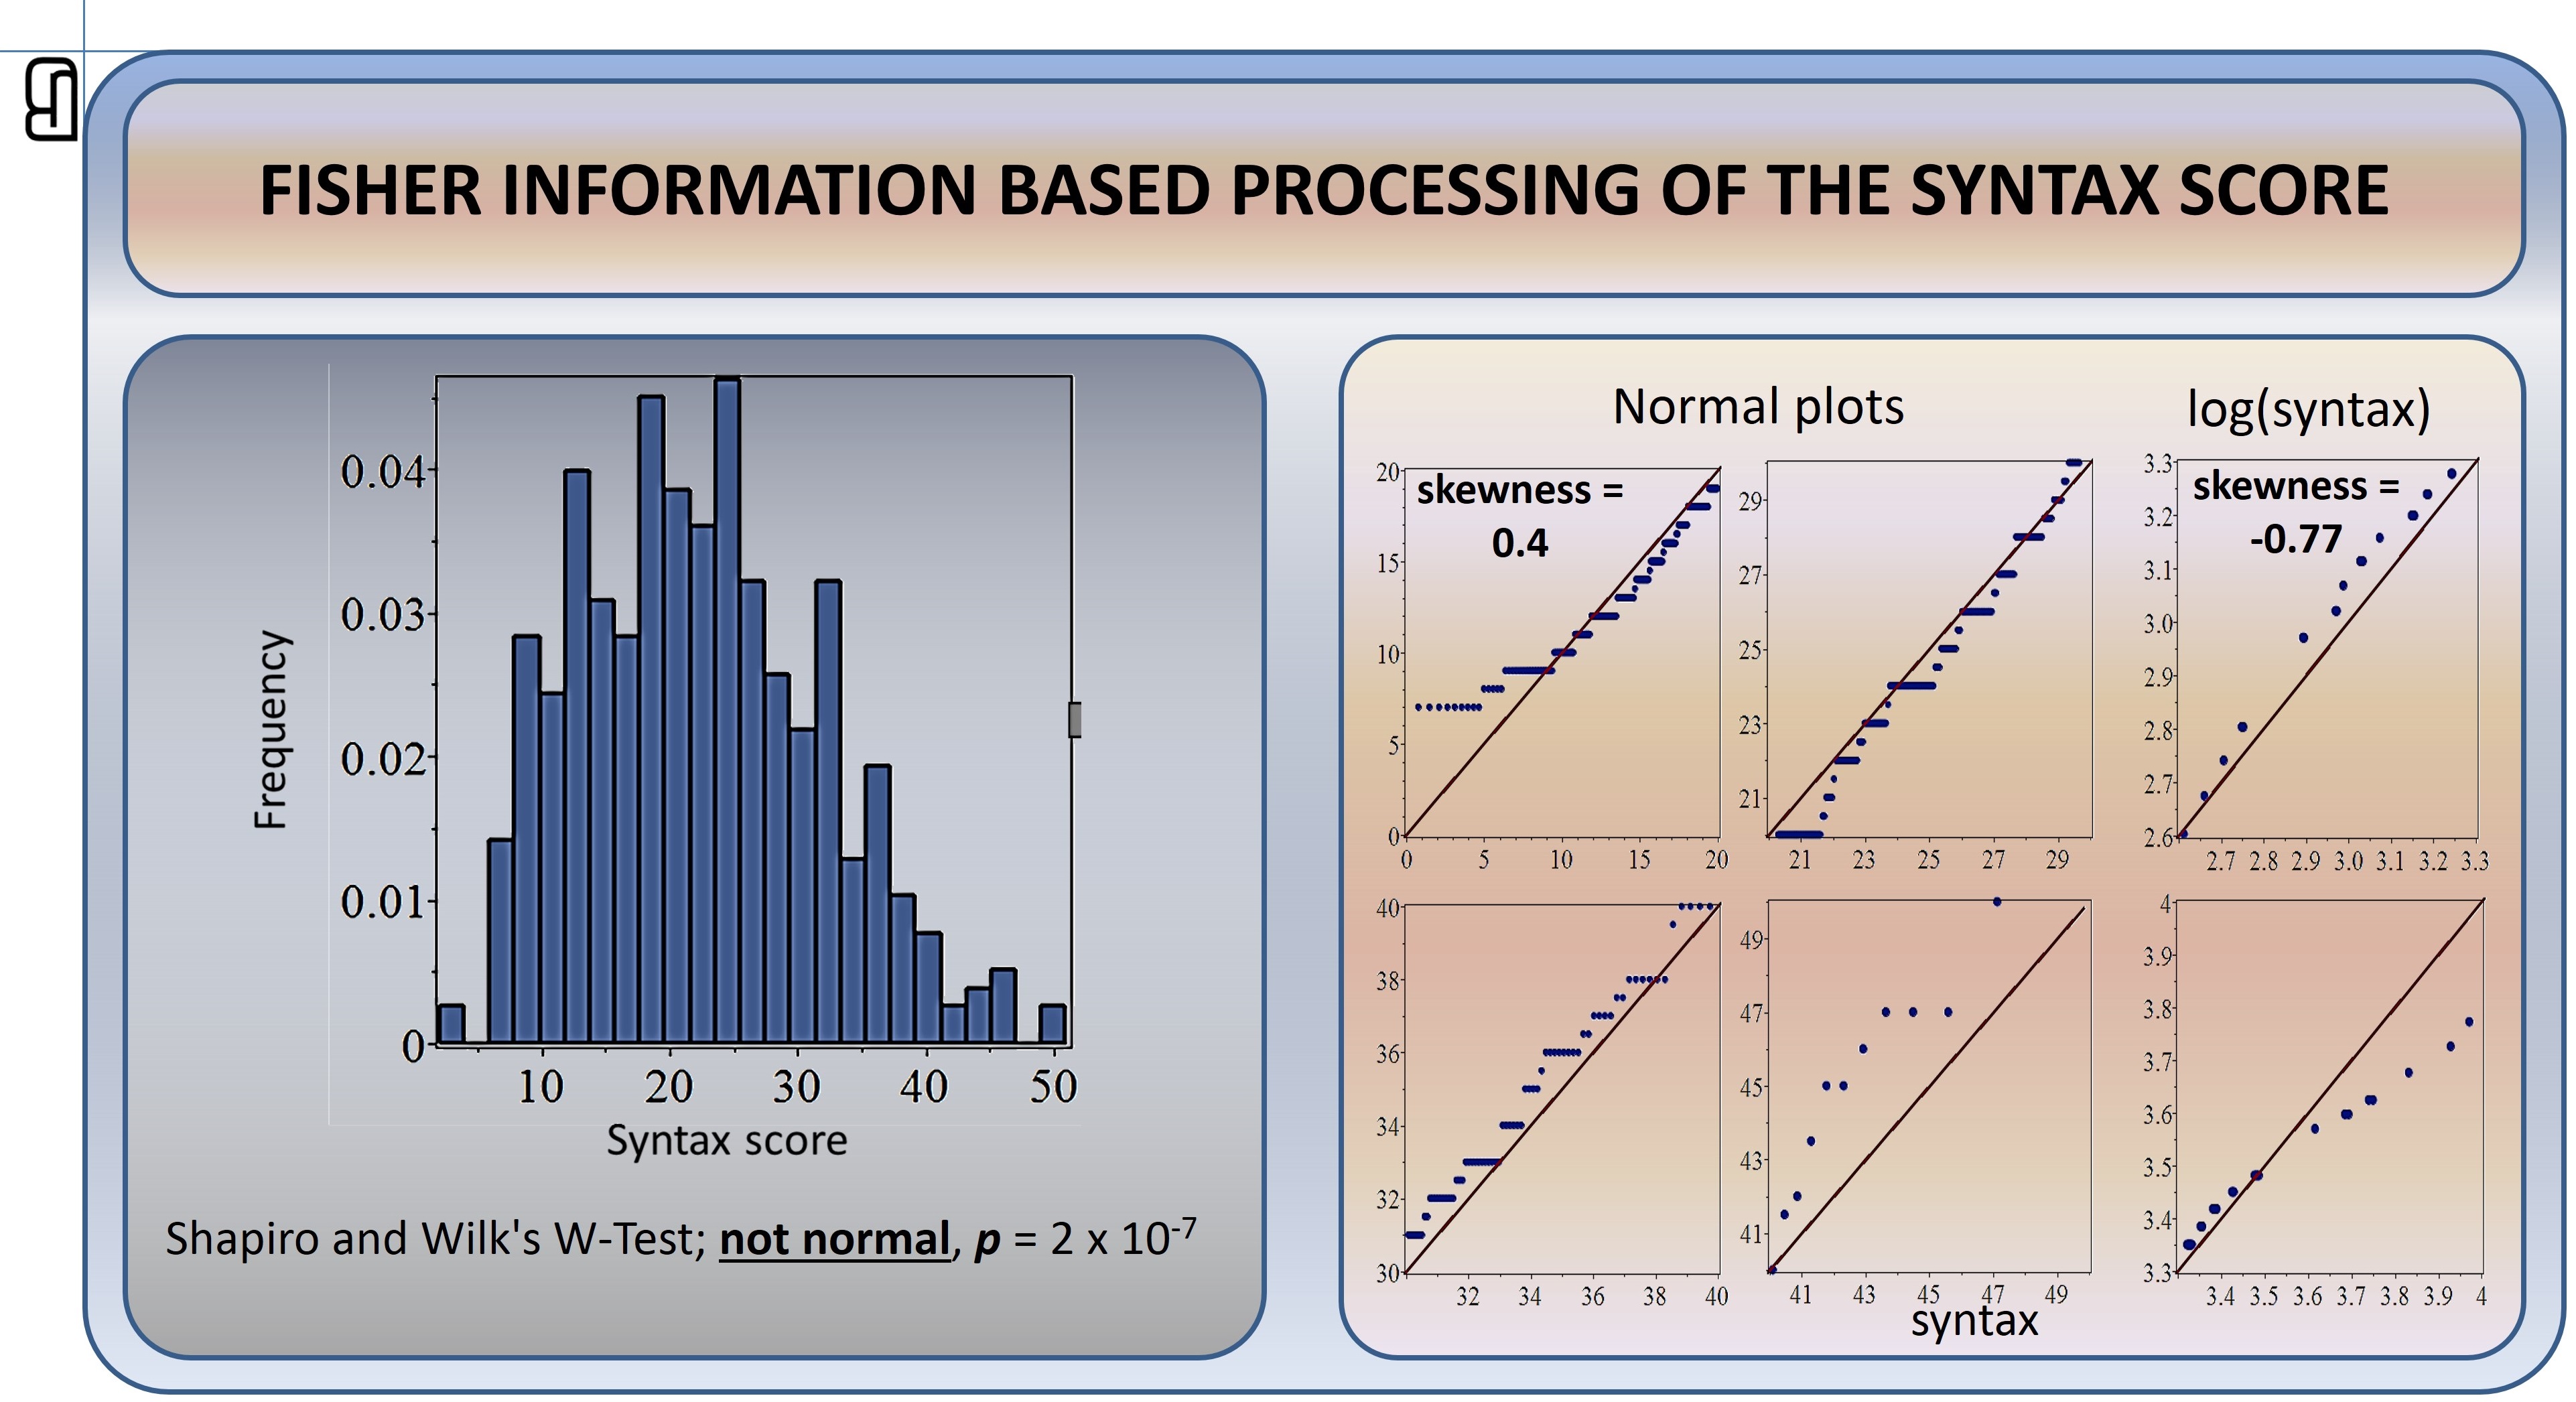
In applying this formalism to indicate how to use the quantified complexity of coronary artery disease for a treatment decision, the first question is: is the Syntax score for the patients distributed normally or not?
Because normality testing indicates that the Syntax score data deviate significantly from the normal distribution (see below), the tools of Fisher information analysis are appropriate, as they will be “chasing” the factors behind systematic non-randomness in the Syntax score values.
The Fisher information processing of the non-normal shape of the Syntax score histogram is derived from a very simple, common-sense condition. First, we assume that there are several (k) internal processes (in the arteries) that influence the disease-related (phenotype-related) information in the experimental observations (made through imaging, etc.). These functional processes combine into internal “information” kI.
Second, we know that the actual observations on a patient are combined into the Syntax score, which represents the external information (Je) about the phenotype. For deriving the tools to extract the clinically relevant information from the Syntax score histogram shape, we require equality of the internal and external information:
kI = Je.
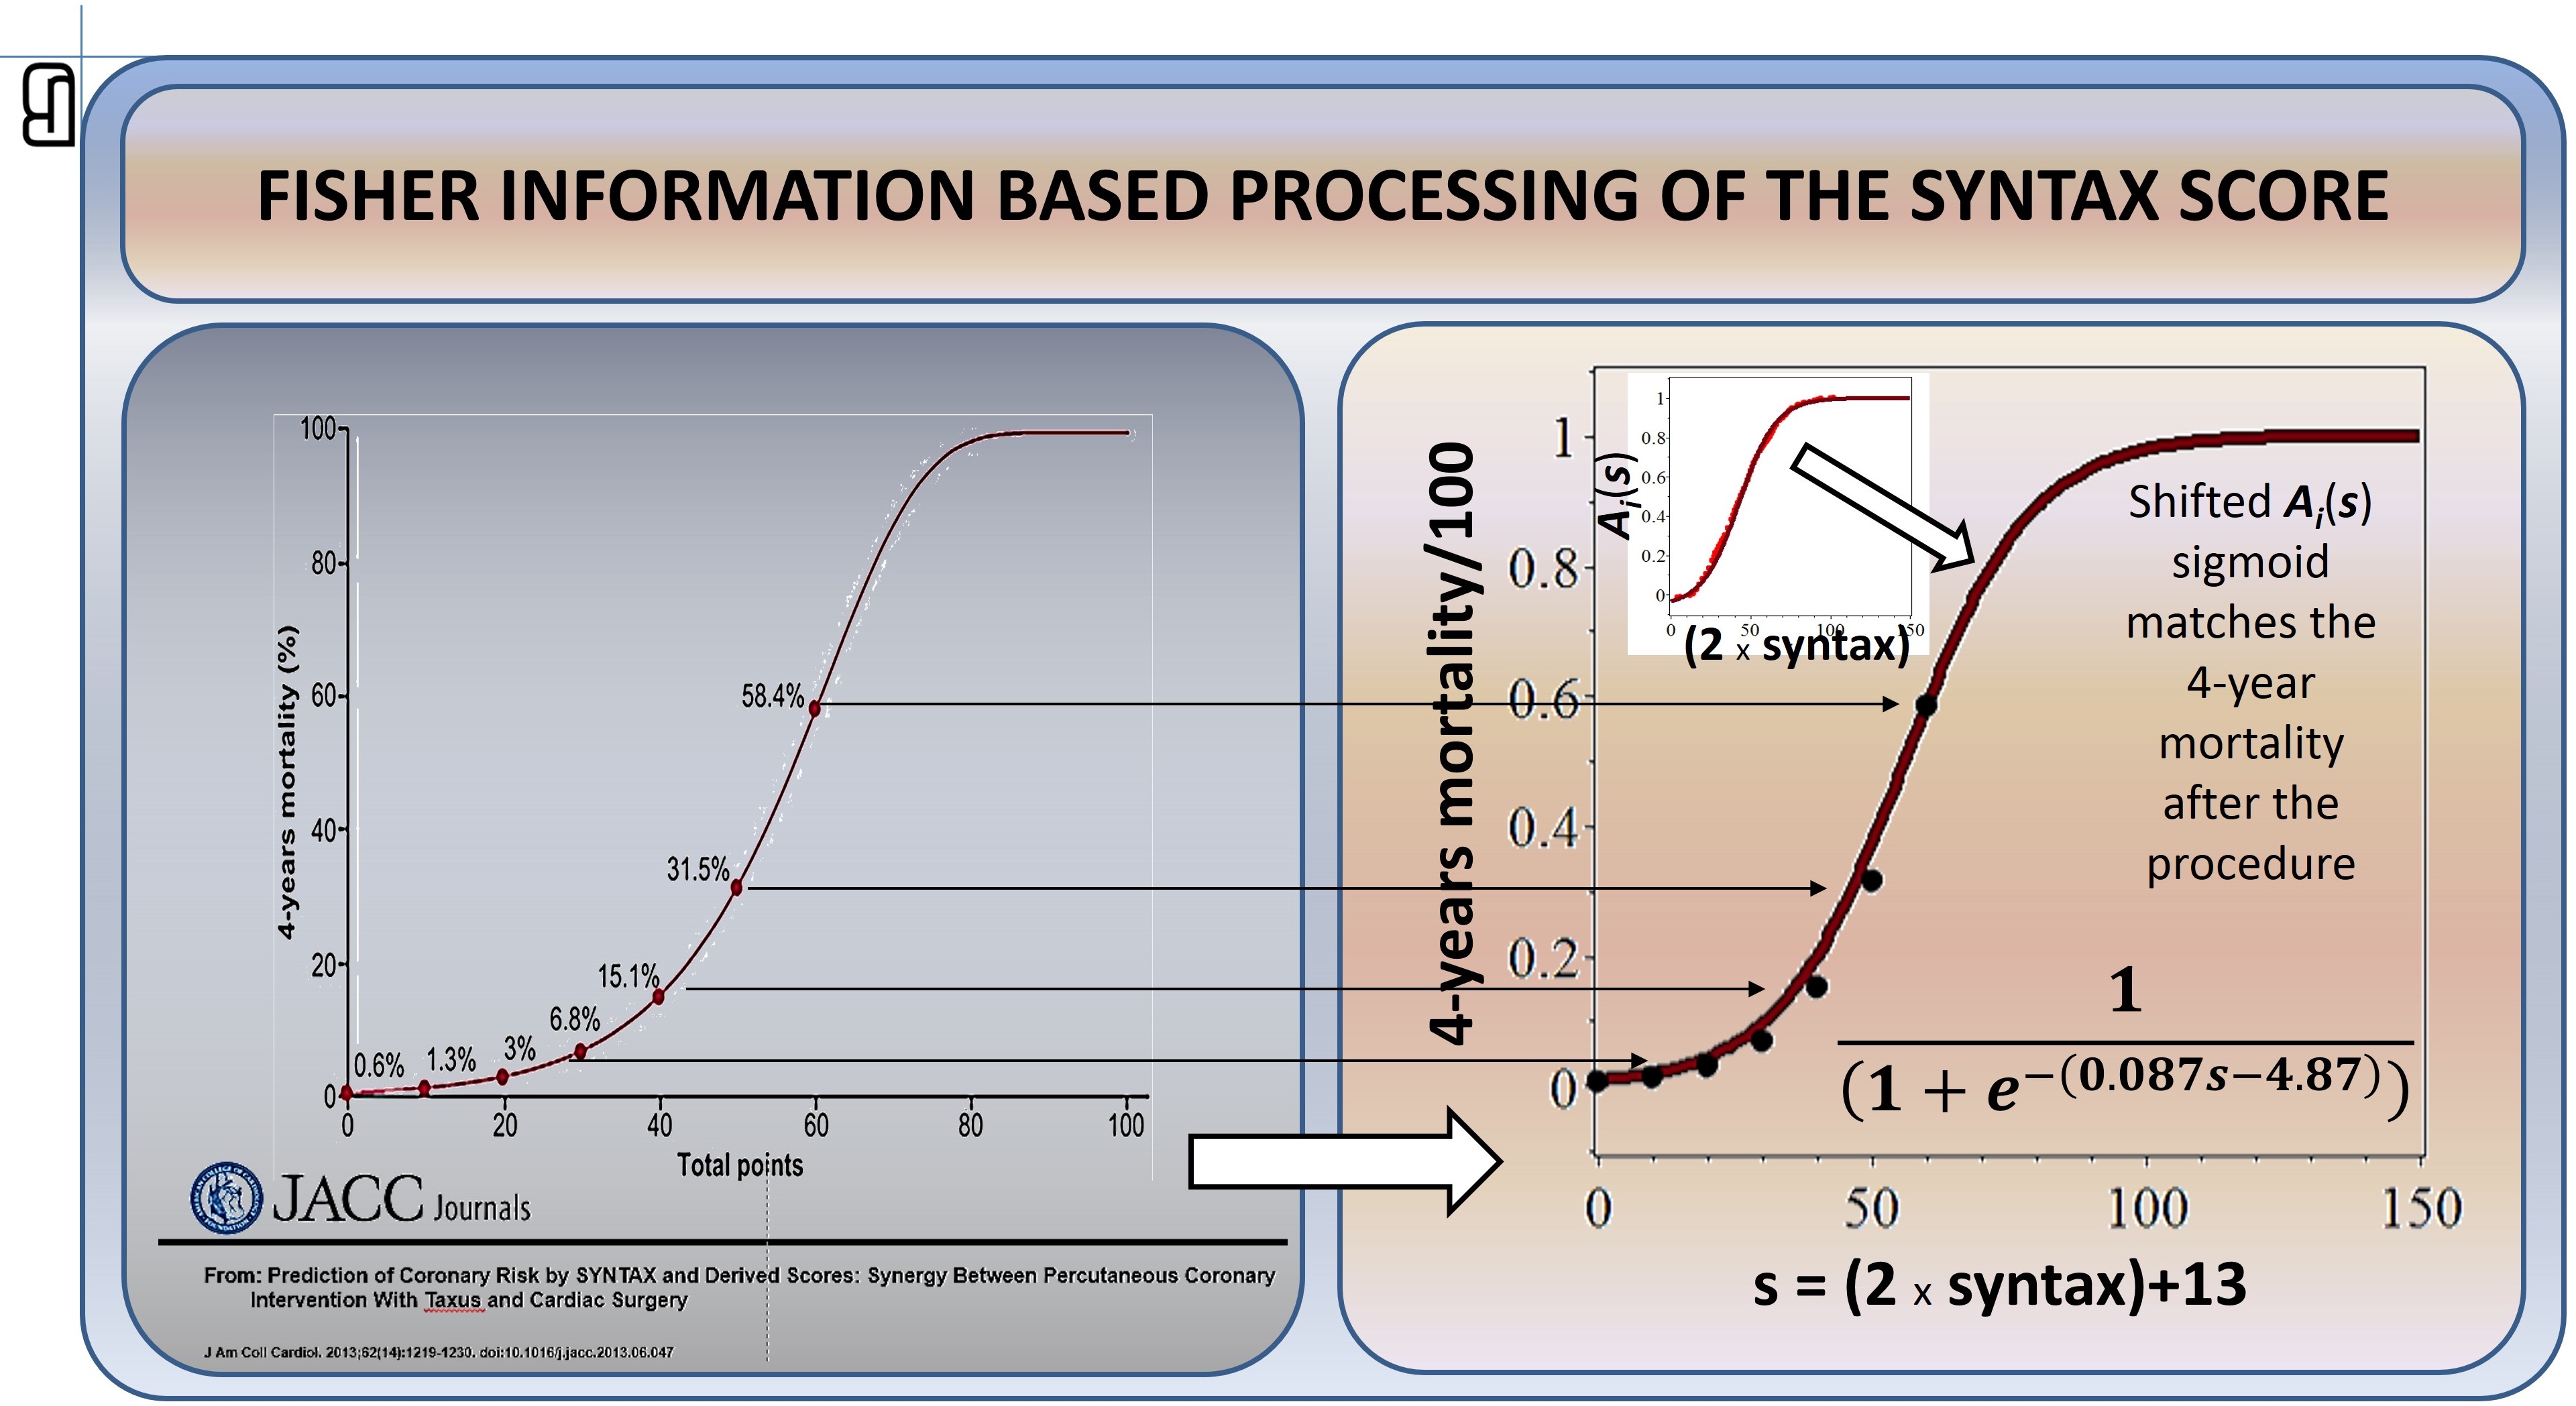
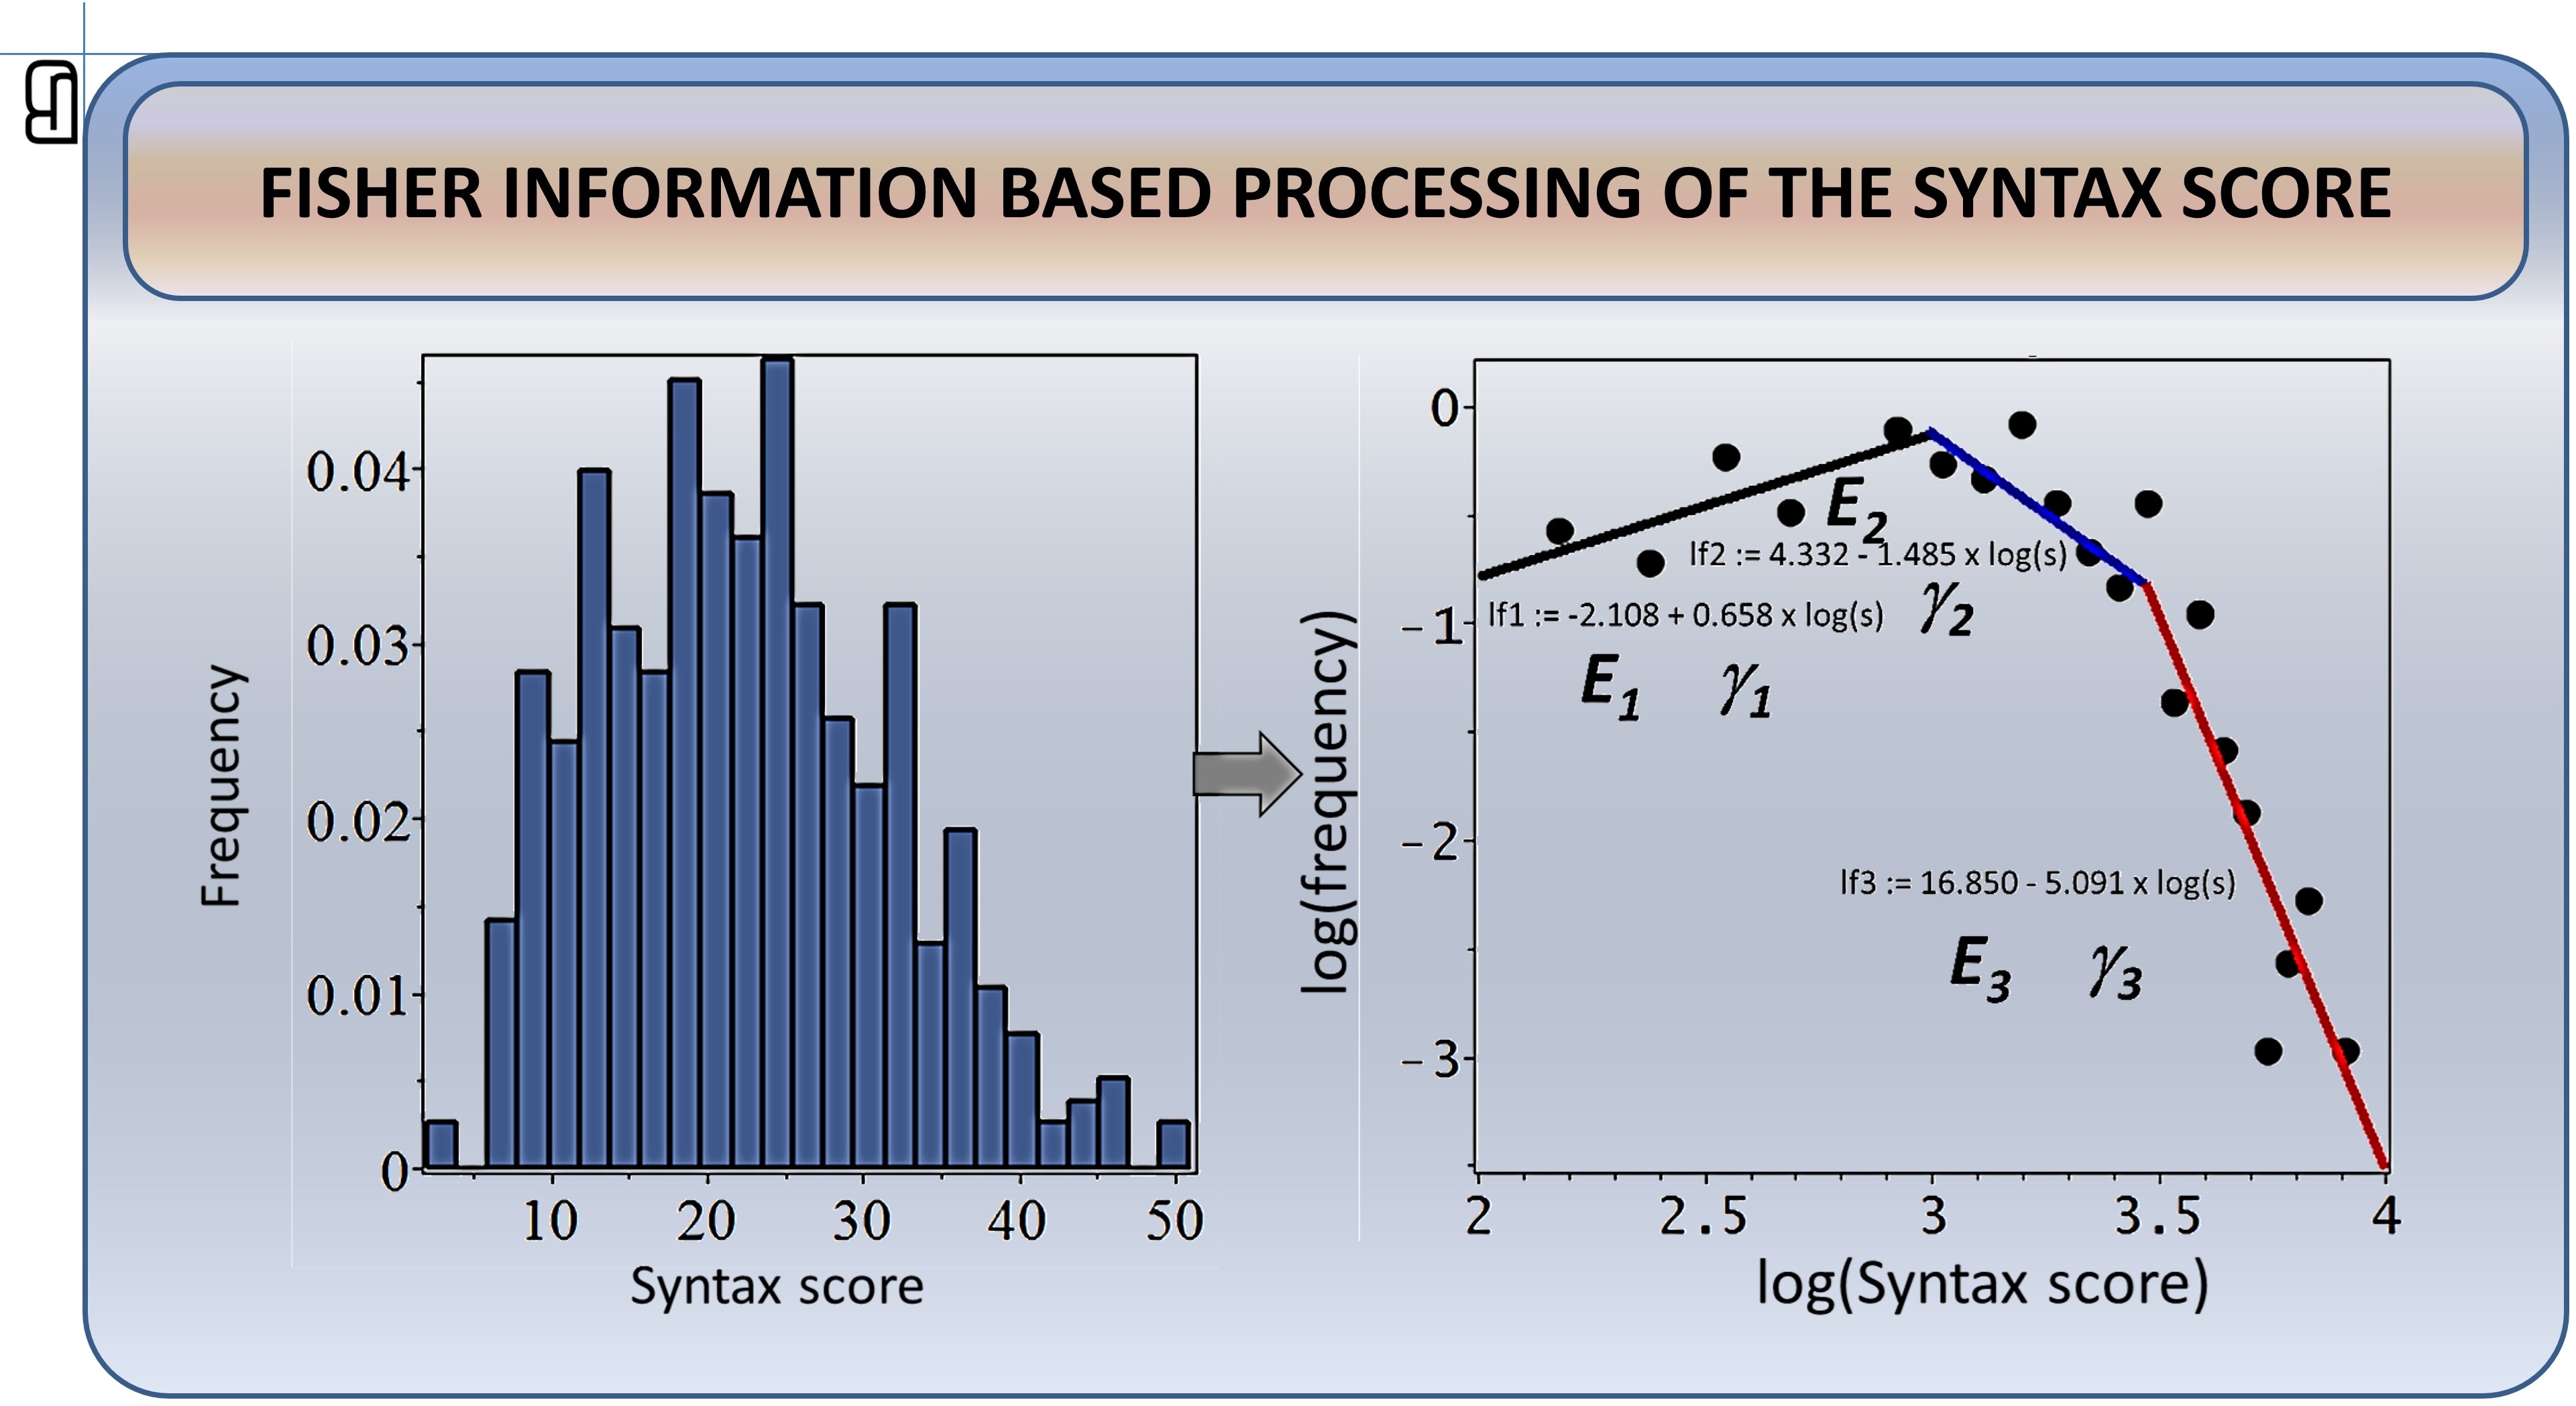
Starting from this simple and common-sense requirement, there is a one-way road of mathematical derivations (see this link for details). The result is a general power law with disease-specific parameters, relating the patient’s values of the Syntax score to the probability of finding that Syntax score (which is identical to the height of the Syntax score histogram bar for the given value of the score). Thus, because we know both the patient’s Syntax scores and the histogram-based values of the probability densities for respective values of the score, we can test whether the theoretical relationship matches the clinical facts (see below).
Fisher information processing uses local characterization of the probability that a score value is observed. This is in contrast to most conventional statistical methods, which instead use global characteristics of the random-variable distributions (mean, variance, moments …). This “localness” is the essential property of the approach, allowing the non-normality of the data histogram to be quantitatively included in the analysis: Fisher information primarily describes how the probability of observing a certain score value for a patient changes from one bar of the score histogram to the next (i.e. how different the probability of observing score 11 is from the probability of observing score 10 in the study cohort).
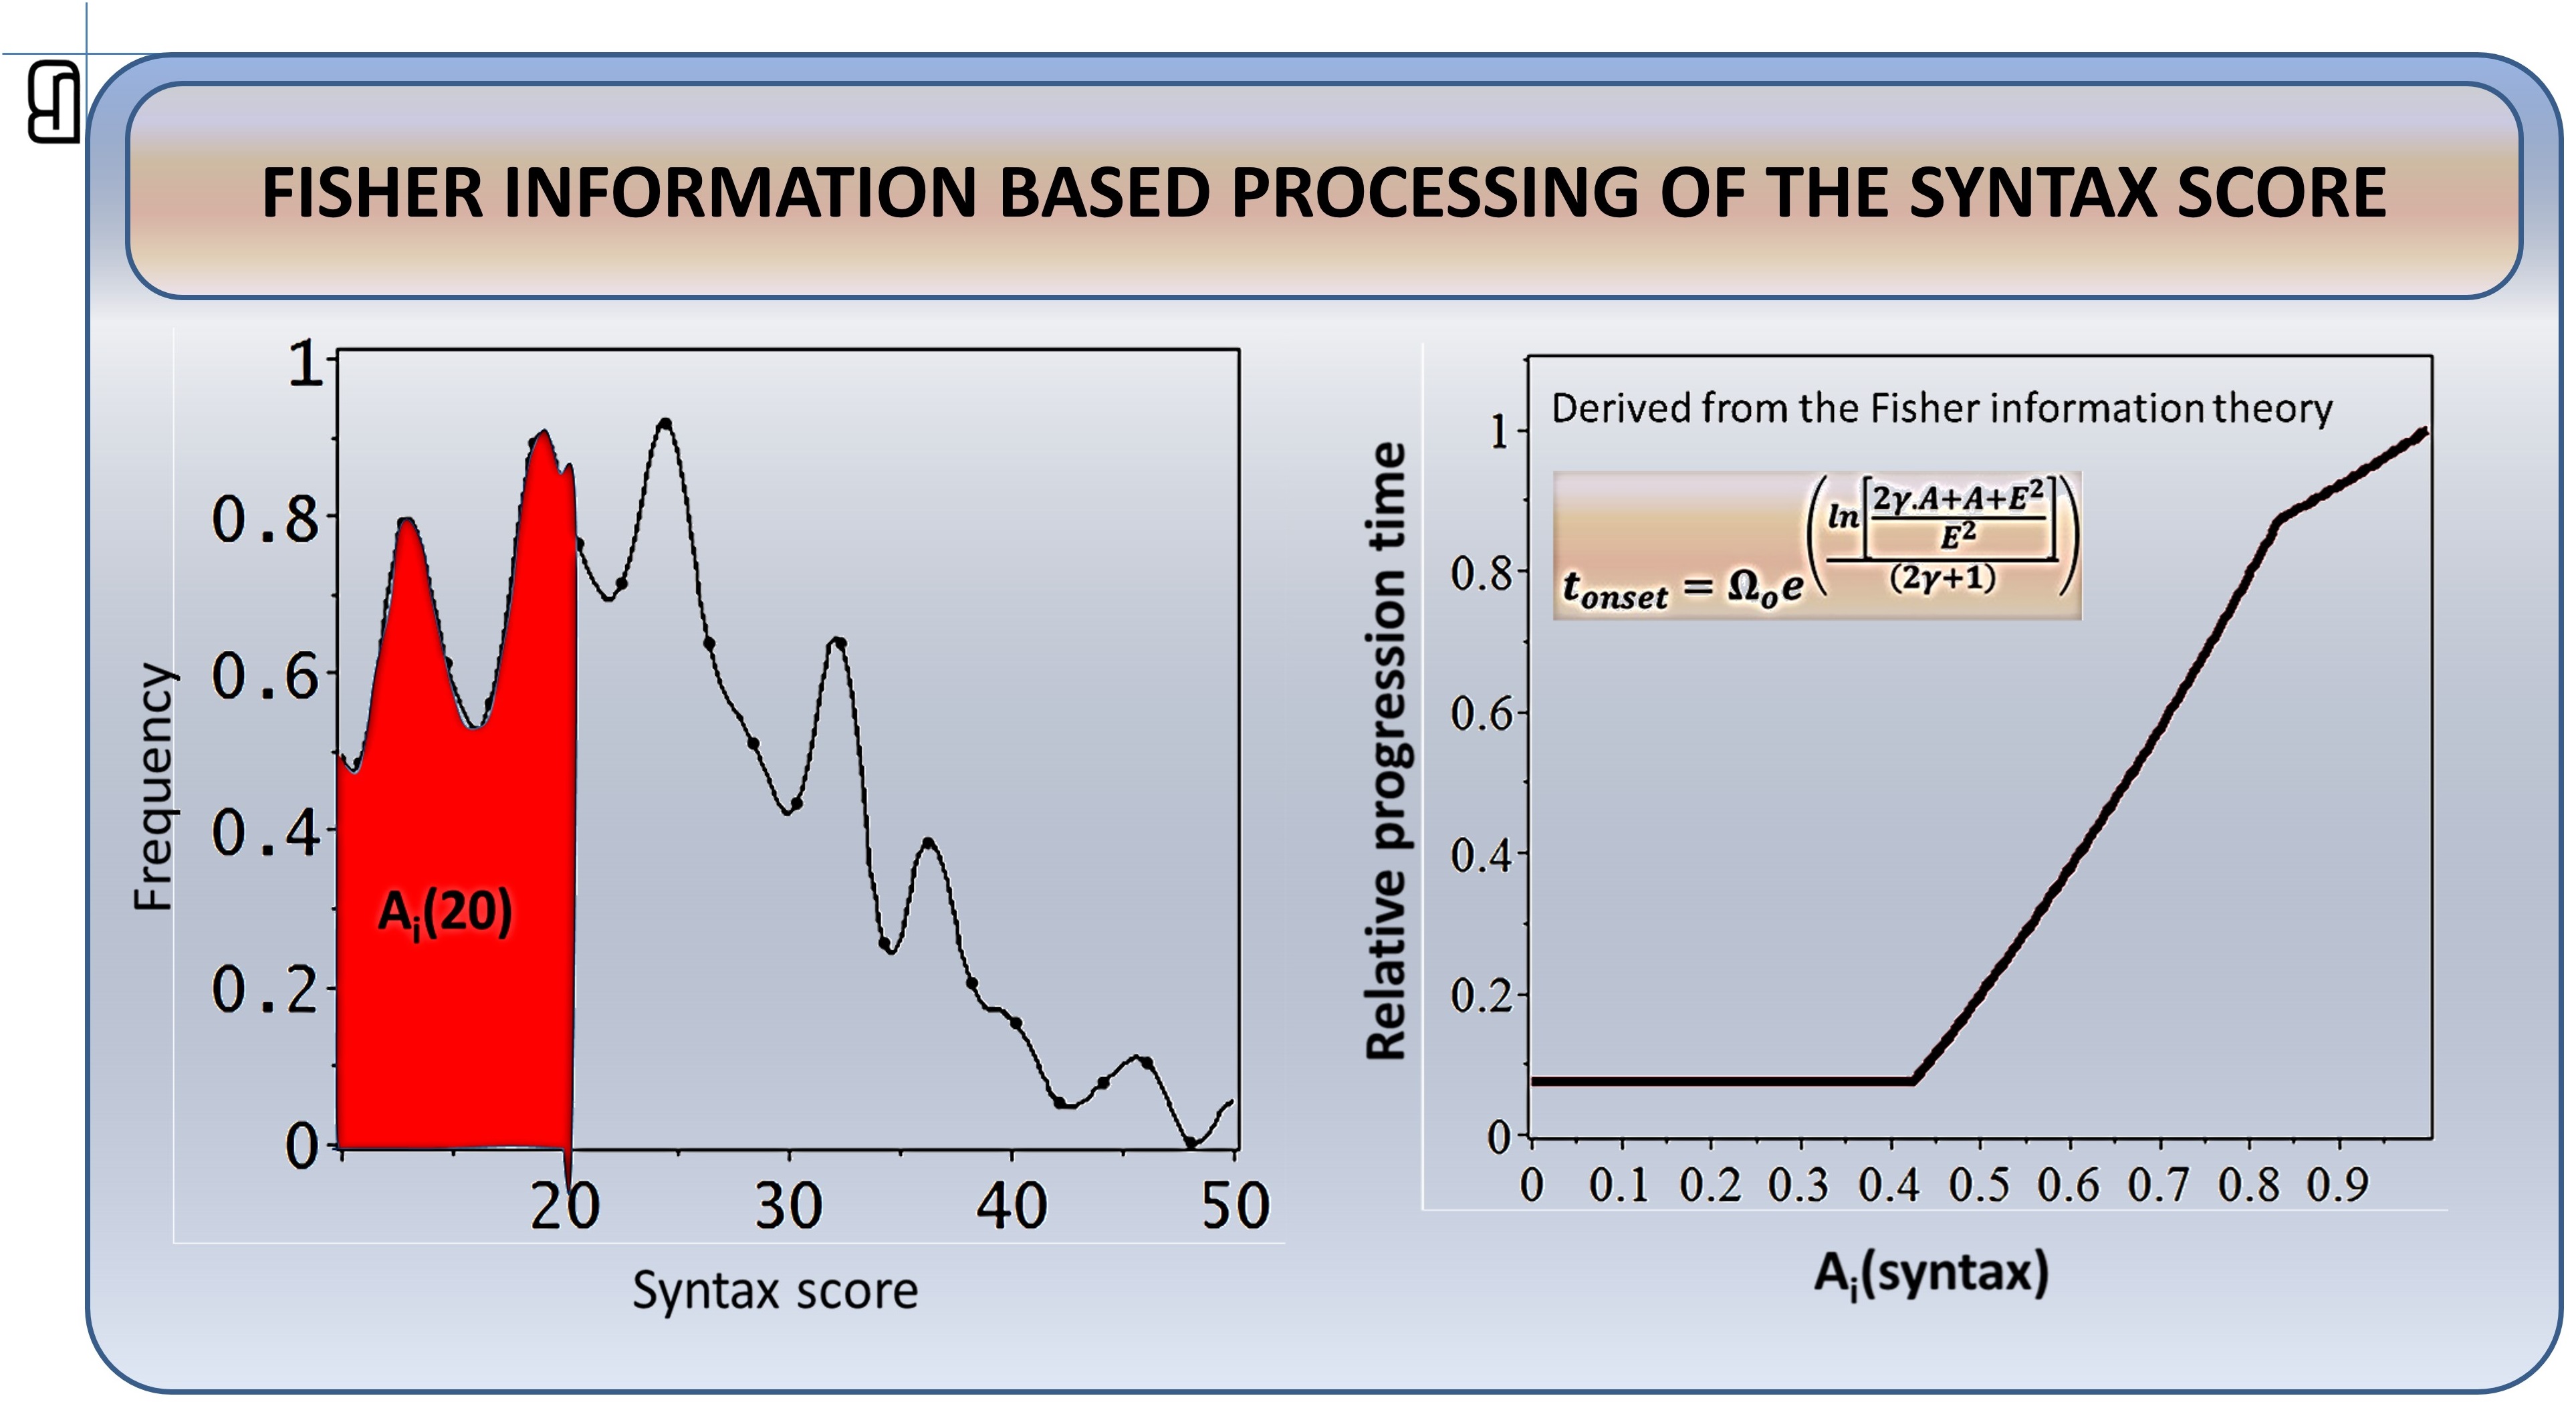
In this way we now have a tool through which we can describe the actual baseline Syntax score value as the result of a progression process, as the patient’s arteries changed from the normal status (and the zero Syntax score) to the actual clinical status at baseline. To describe this clinical progression quantitatively, the local Fisher information descriptors of the Syntax score value probabilities (= histogram bars) should be integrated from zero to the actual patient’s value (numerically, this personal descriptor is the area Ai(s) of the corresponding Syntax score histogram region — see the red area in the scheme below).
Through this integration operation, the information about the (non-normal) shape of the score histogram directly and quantitatively contributes to the novel characterization of the patient’s Syntax score by the personal area Ai(s).
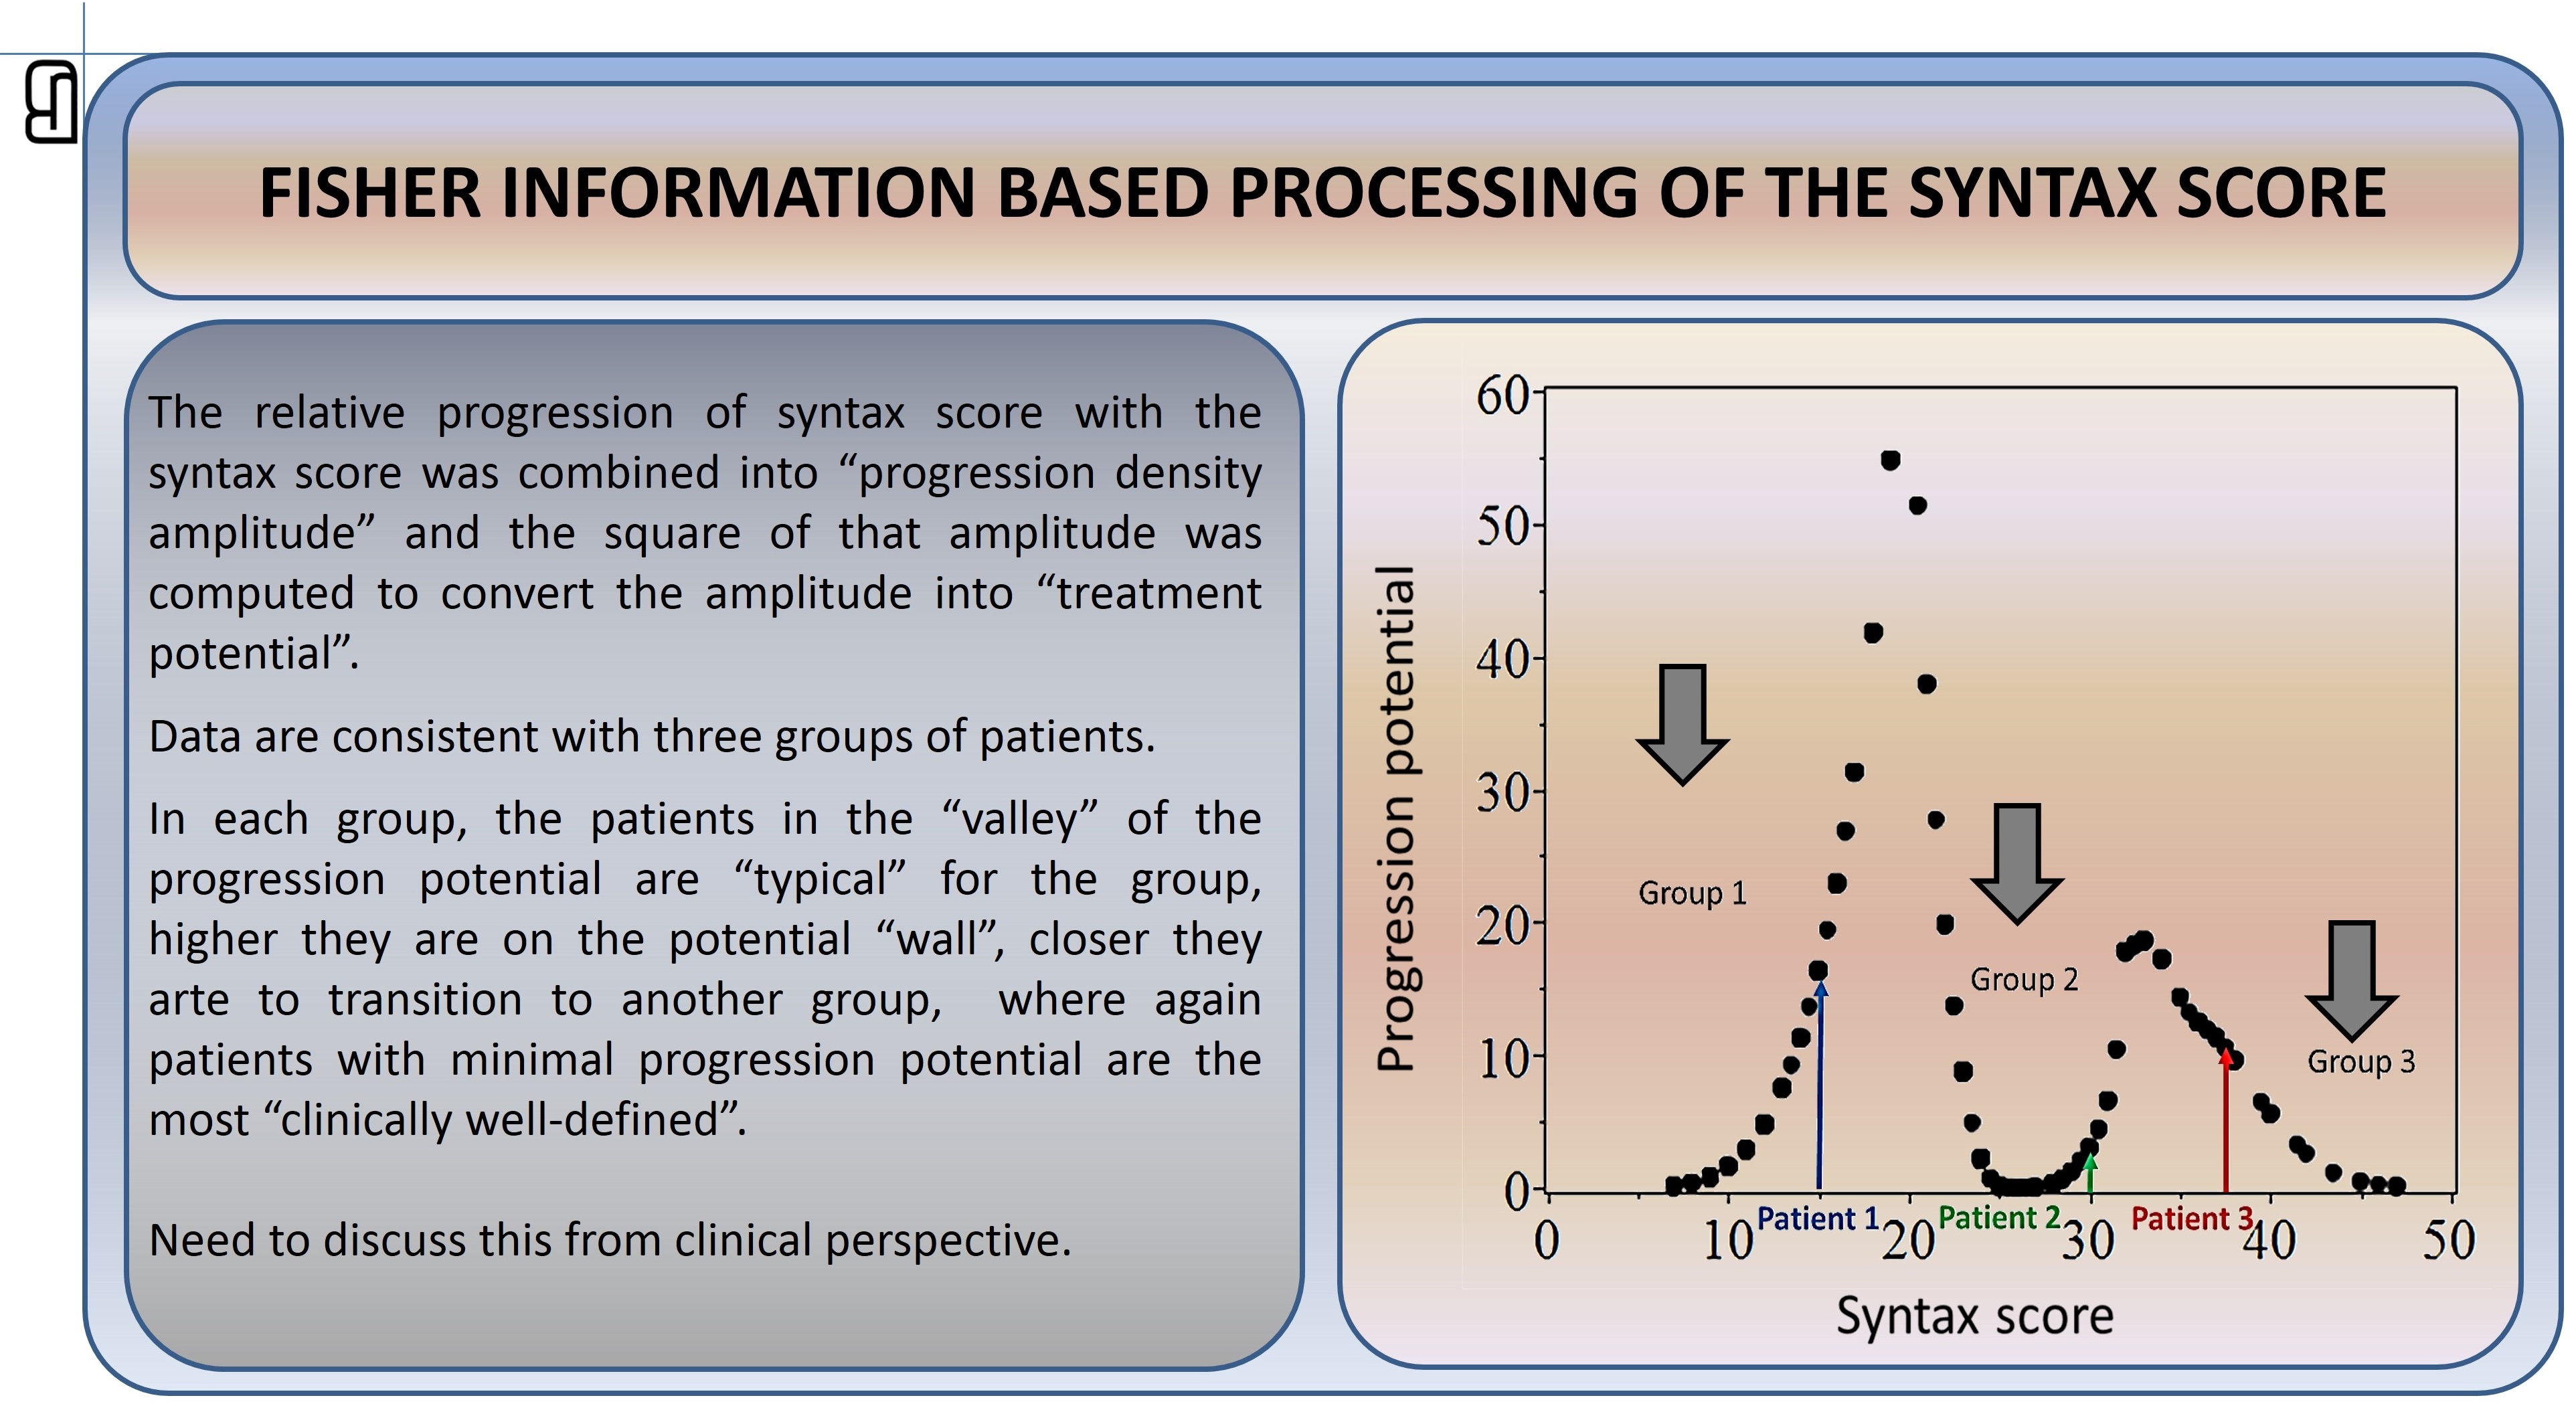
Now we can interpret the presence of three linear relationships in the log-log transformed histogram of the Syntax scores in the cohort: there are three different progression rates of the processes in the arteries. This heterogeneity is characterized by the Syntax score intervals 0–18, 18–30 and above 30 (there might be additional sub-regions here: 30–40 and above 40). In addition to this categorical classification of patients into groups, Fisher information processing provides the personal value of a patient’s progression potential, which indicates how distant every patient is from the clinical status typical for each subgroup. This personal status characterization is a non-linear (= non-obvious) function of the Syntax score value. Progression potential thus provides a new quantitative ordering of the patients within the three groups, obtained independently of any other information about the patients. We can now quantitatively test hypotheses about treatment-outcome differences in these sub-cohorts.